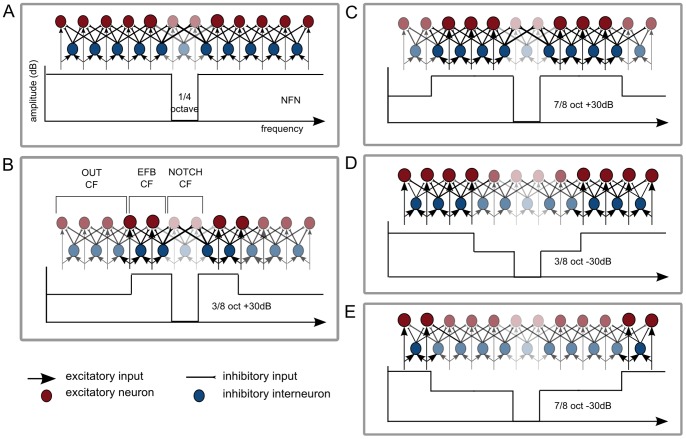
Figure 1. Schematic representation of neural mechanisms as evoked by the masking stimuli (MS).
A. The lower part of the figure shows the frequency spectrum of the MS. The upper part is a highly simplified representation of neural activity in the auditory cortex as evoked by the MS. Neurons (excitatory = red, inhibitory = blue) are represented tonotopically. Transparent colors indicate reduced activation of inhibitory and excitatory neurons. Enlarged circles represent enhanced activation of neurons. B. Neurons with characteristic frequencies (CF) corresponding to the outer frequencies of the masking stimulus (OUT CF), the edge frequency bands (EFB) around the notch (EFB CF) and the frequencies within the notch (NOTCH CF) are further defined. A, B, C, D and E show the hypothesized modulation of neural mechanisms by MS with different spectral contrasts. The amount of lateral inhibition of neurons with NOTCH CF is hypothesized to be modulated in the following order (beginning with the greatest lateral inhibition of NOTCH CF): 3/8 oct +30 dB >7/8 oct +30 dB>NFN >3/8 oct −30 dB >7/8 oct −30 dB.

