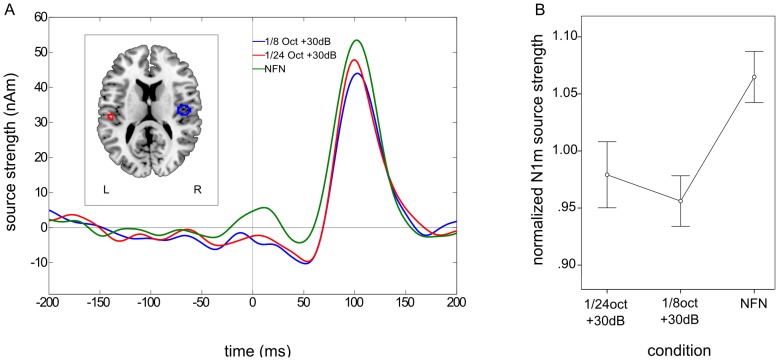
Figure 7. Grand averaged source waveforms and normalized N1m responses – experiment 2.
A. Grand averaged source waveforms for the N1m time window in the second experiment. N1m source strength is lower in both amplified edge frequency bands (EFB) conditions than in the notch-filtered noise (NFN) condition. N1m source strength in the narrower EFB amplification condition (1/24 oct +30 dB) seems to be greater than in the wider EFB amplification condition (1/8 oct +30 dB). The left panel shows the normalized source locations of both equivalent current dipoles (ECD) transformed to a standardized magnetic resonance imaging (MRI) brain. B. Mean normalized N1m values confirming the observed results in the grand averaged source waveforms.

