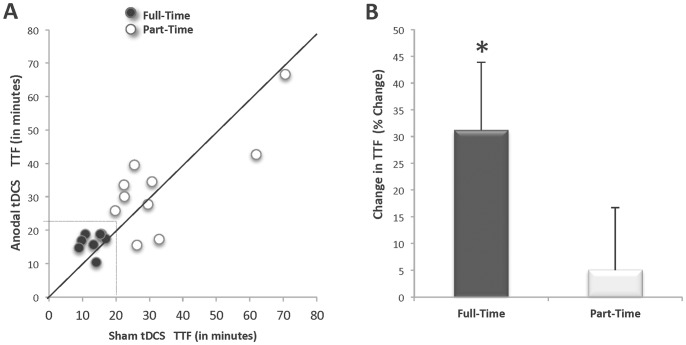
Figure 5. Anodal tDCS prolongs the time to task failure in subjects who received the stimulation through task failure (i.e., those who reached task failure before the anodal tDCS was discontinued).
A. Individual time to task failure, B. Group percent change in time to task failure. A. Full-Time Group (filled circles): subjects for whom transcranial direct current stimulation (tDCS) was delivered through task failure in both stimulation conditions (n = 8). Part-Time Group (open circles): subjects for whom the tDCS terminated before they reached task failure for one or both stimulation conditions (n = 10). Solid line designates equivalent time to task failure (TTF) for both conditions. Dashed lines signify maximum tDCS stimulation duration. Data points above the solid line indicate that the TTF for the Anodal tDCS stimulation condition was longer than the TTF for the Sham condition. Seven of the 8 Full-Time subjects had a longer TTF with Anodal tDCS. An equal number of Part-Time subjects (n = 5 and n = 5) are on both sides of the equivalence line. B. Percent change in TTF with anodal stimulation by group. Mean percent change in time to task failure increased for the Full-Time group with Anodal tDCS but not for the Part-Time group (*p<.05).

