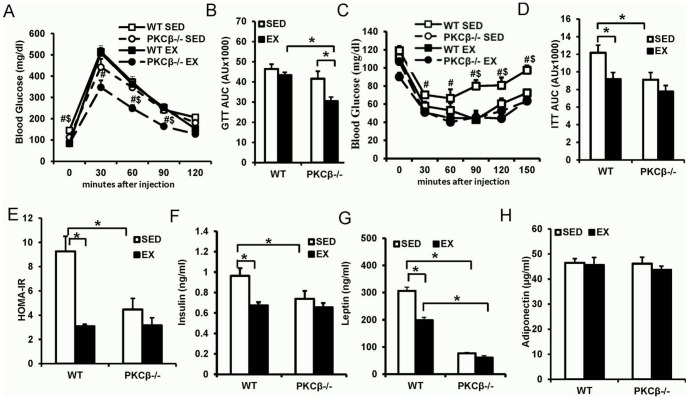
Figure 4. Effect of exercise and PKCβ deficiency on insulin resistance.
A & B, Intraperitoneal glucose tolerance test (IPGTT) in WT and PKCβ-/- mice with or without exercise. A, Blood glucose responses; B, Area under the curve (AUC) of IPGTT. C & D, Intraperitoneal insulin tolerance test (IPITT) in WT and PKCβ-/- mice with or without exercise. C, Blood glucose curve; D, Area under the curve (AUC) of IPITT. E, Homeostasis model assessment-estimated insulin resistance (HOMA-IR) in WT and PKCβ-/- mice with or without exercise. HOMA-IR was calculated using the formula HOMA-IR = fasting glucose (mg/dl) x fasting insulin (µU/mL)/405. F, Fasting serum insulin level. After 16 h of fasting, serum was collected for ELISA detection of insulin. Exercise decreased fasting insulin level in WT but not in PKCβ-/- mice. Insulin level in sedentary PKCβ-/- mice was lower than that of sedentary WT mice. G, Fasting serum leptin level. After 16 h of fasting, serum was collected for ELISA detection of leptin. Exercise decreased fasting leptin level in WT but not in PKCβ-/- mice. Leptin level in sedentary PKCβ-/- mice was lower than that of sedentary WT mice. H, Fasting serum adiponectin level. After 16 h of fasting, serum was collected for ELISA detection of leptin. No significant difference of adiponectin was detected among the 4 groups. WT, wild-type; EX, exercise; SED, sedentary; Data are expressed as mean ± SEM; n = 8, #, P<0.05, WT vs. PKCβ-/-; $, P<0.05, EX vs. SED; *, P<0.05.

