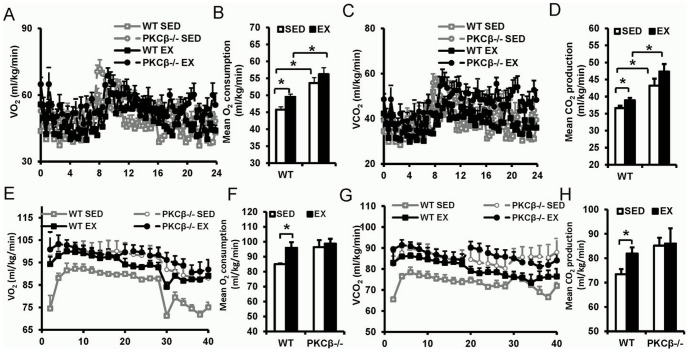
Figure 5. Metabolism increased after exercise in WT but not in PKCβ-/- mice.
A, Resting O2 consumption over 24 hours. O2 consumption of WT and PKCβ-/- mice with or without exercise was measured in a resting state for 24 hours using a computer-controlled, Comprehensive Lab Animal Monitoring System (CLAMS). B, Average resting O2 consumption in WT and PKCβ-/- mice with or without exercise. C, Resting CO2 production over 24 hours. CO2 production of WT and PKCβ-/- mice with or without exercise was measured in a resting state for 24 hours at 22°C in presence of food and water using CLAMS. D, Average resting CO2 production in WT and PKCβ-/- mice with or without exercise. E, O2 consumption with exercise intervention. O2 consumption of WT and PKCβ-/- mice with or without exercise was measured. F, Average exercise O2 consumption in WT and PKCβ-/- mice with or without exercise. G, CO2 production with exercise intervention. CO2 production of WT and PKCβ-/- mice with or without exercise was measured. H, Average exercise CO2 production in WT and PKCβ-/- mice with or without exercise. WT, wild-type; EX, exercise; SED, sedentary; Data are expressed as mean ± SEM; n = 5, *, P<0.05.

