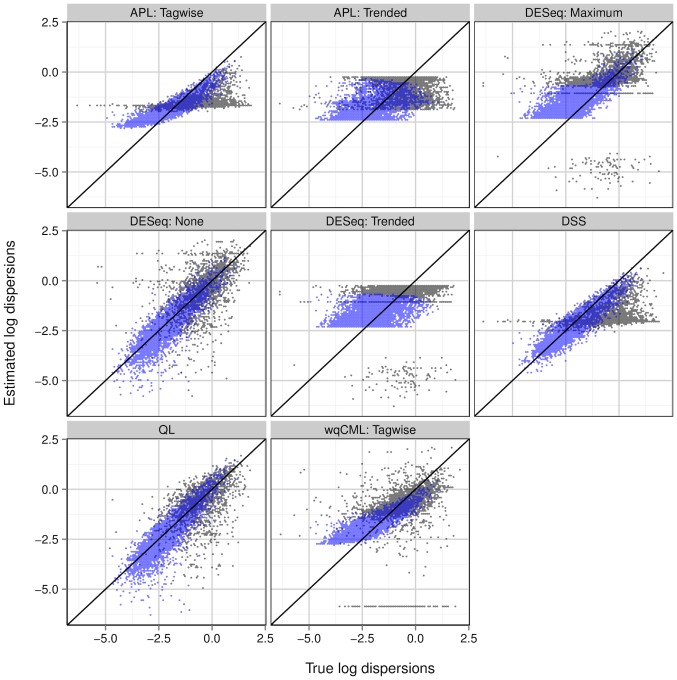
Figure 4. Simulation setting II: estimated vs true dispersions for an example pseudo-dataset.
Dispersions with gene-wise log geometric mean counts below the median (log mean from  2.17 to 1.63) are shown in black, while those above the median (log mean from 1.63 to 10.6) are shown in light blue. Overlapping points are shown in dark blue. Results for simulation settings I and III are similar.

