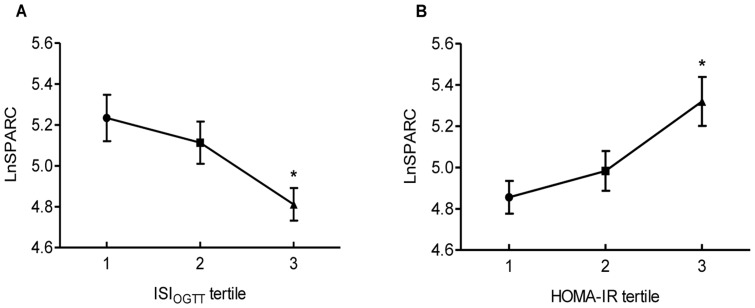
Figure 1. A. LnSPARC in ISIOGTT tertiles; B. LnSPARC in HOMA-IR tertile.
Data were shown mean±SEM. SPARC were logarithmically transformed for comparison. Differences between groups were assessed by One-way ANOVA. SPARC plasma levels are decreased from first to third tertile of ISIOGTT and increased from first to third tertile of HOMA-IR. A. * p = 0.003, T3 vs T1; p = 0.033, T3 vs T2; B. *p = 0.001 T3 vs T1; p = 0.017, T3 vs T2.

