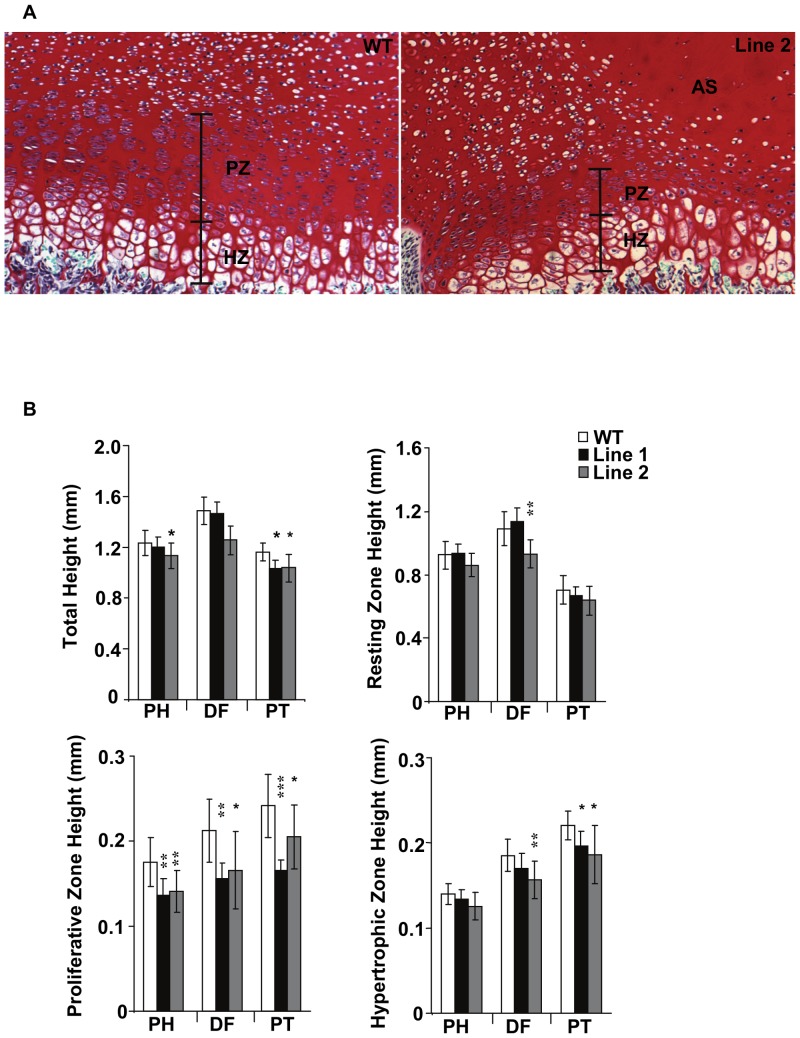
Figure 3. Growth plate analysis of P7 pups.
(A) Growth plates from WT and Line 2 femurs showing the reduced proliferative zone and the acellular swath observed in the transgenic animals. (B) Analysis of total, resting, proliferating, and hypertrophic growth plate heights from proximal humerus (PH), distal femur (DF) or proximal tibia (PT). The largest decrease in growth plate height was observed in the proliferating zones of Tg animals compared to WT. *p≤0.05, **p≤0.01, ***p≤0.001 RZ, Resting Zone; PZ, Proliferative Zone; HZ, Hypertrophic Zone; AS, Acellular swath.

