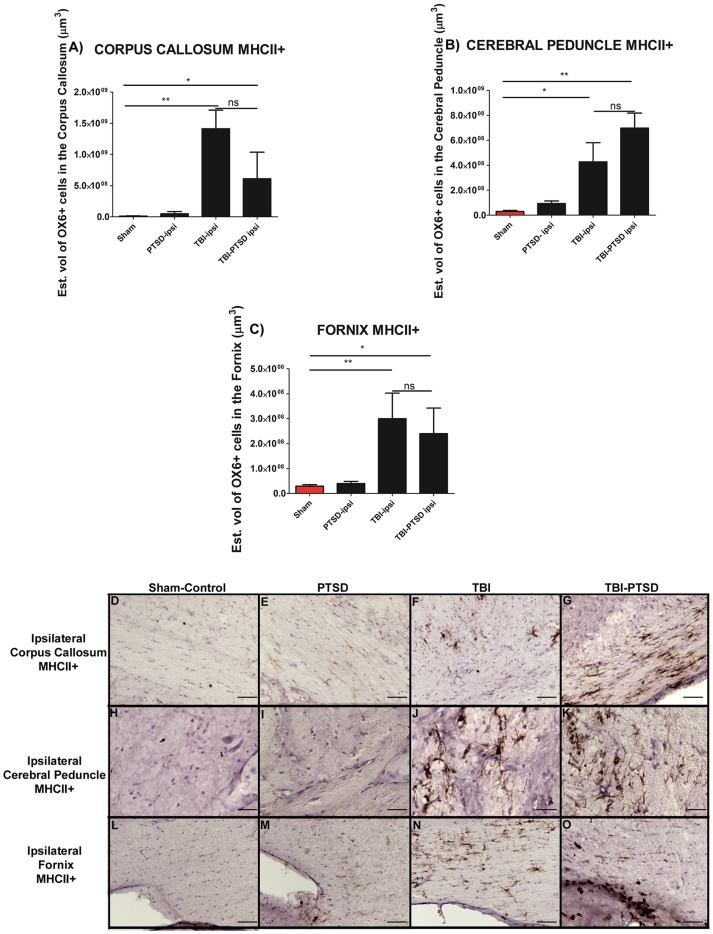
Figure 2. OX6 + expression in ipsilateral subcortical white matter regions of TBI and TBI-PTSD rats.
Figures 2 A–C represent quantitative data of estimated volumes (µm3) of OX6+ in A) corpus callosum, B) cerebral peduncle, and C) fornix. Figures 2D–G represent OX6+ immunostaining of the ipsilateral side of corpus callosum in D) sham-no PTSD, E) sham-PTSD, F) TBI-PTSD, G) TBI. Figures 2 H–K represent OX6+ immunostaining of the ipsilateral side of cerebral peduncle in H) sham-no PTSD, I) sham-PTSD, J) TBI-PTSD, K) TBI. Figures2 L-O represent OX6+ immunostaining of the ipsilateral side of fornix in L) sham-no PTSD, M) sham-PTSD, N) TBI-PTSD, O) TBI. Corpus callosum, F3,20 = 8.611, **p<0.0017, cerebral peduncle F3,20 = 8.550, **p<0.002, fornix, F3,20 = 8.368, **p<0.002. Scale bars for D, E, F, G, H, I, J, K, L, M, N, O are 1 µm.

