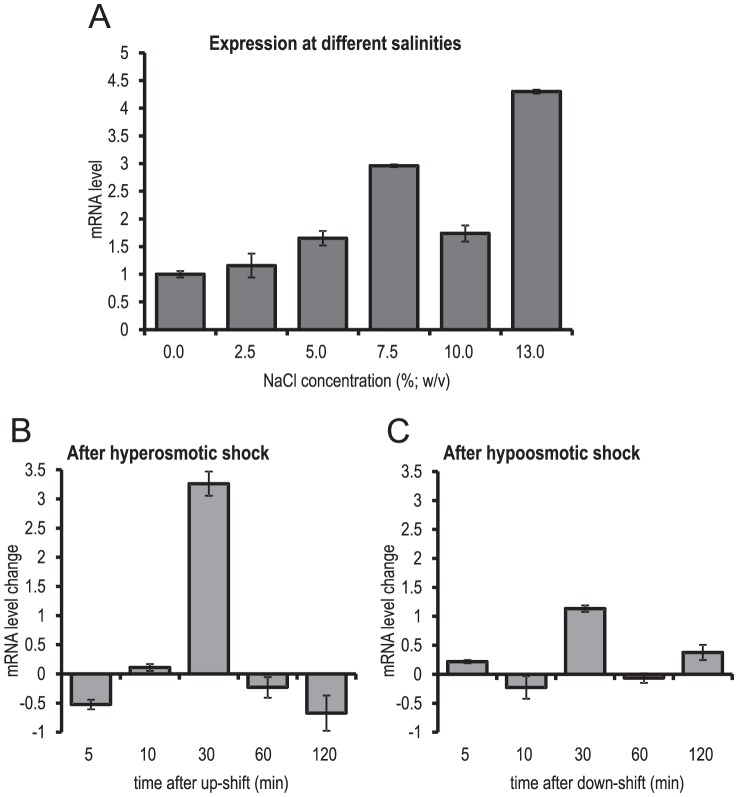
Figure 2. ApHAL2 gene expression with salt adaptation and under stress conditions.
Expression analysis in A. pullulans during constant growth at increasing concentrations of NaCl (A), and after hypersaline (B) and hyposaline (C) shock. The data are relative fold-inductions of cDNA levels, as means (±standard deviation) of two qPCR experiments (biological replicates), each carried out in duplicate, relative to no NaCl in adapted cells (A), and relative to zero time in stressed cells (B, C).

