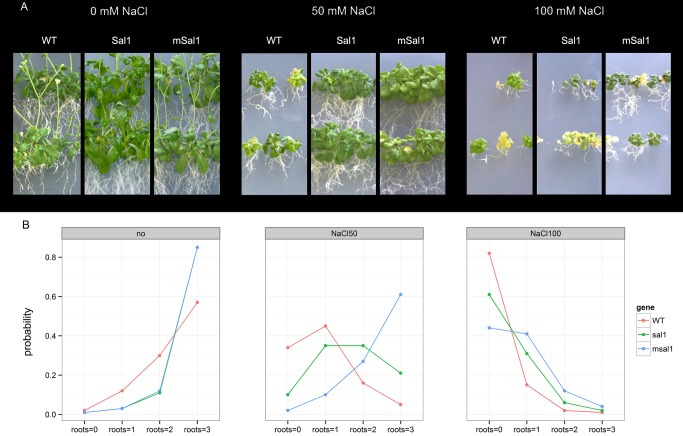
Figure 6. A. thaliana plants exposed to salt stress.
Wild type plants and plants overexpressing SAL1 and mSAL1 (as indicated) were grown for four weeks in medium containing 0, 50 and 100 mM NaCl (as indicated). (A) Representative plants, showing differences in root length under the salt stress. (B) Relative occupancy of root length group – proportion of plants having root length of given category (0, shortest; 3. longest; see Methods). The root lengths were predicted separately from the statistical model for the three genotypes and NaCl concentrations (as indicated), as they were shown to be statistically significant for determining the root length groups (p<0.001).

