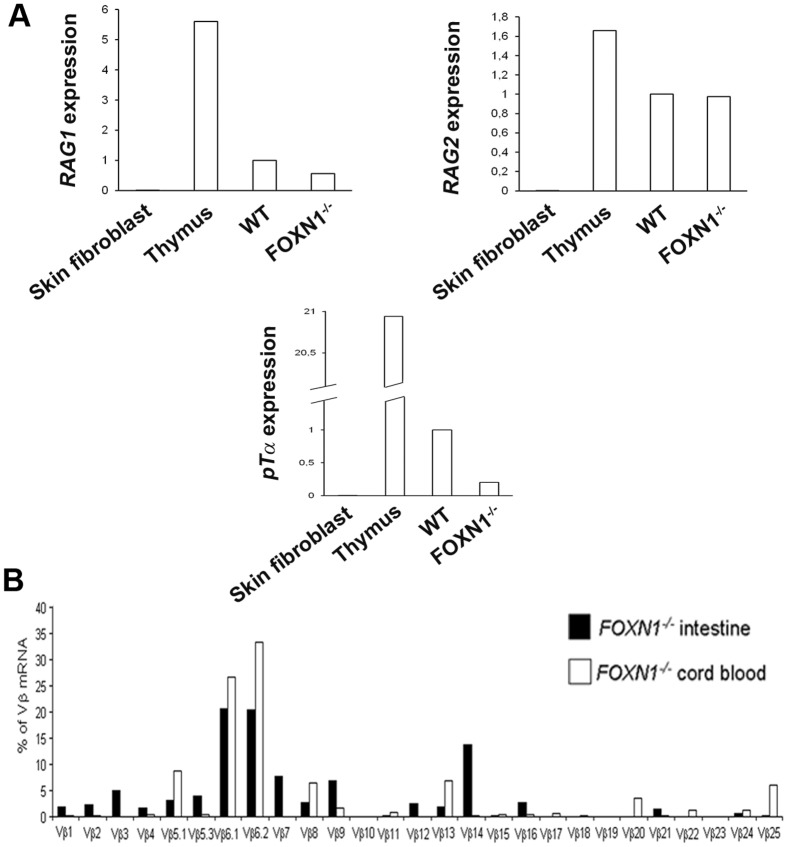
Figure 4. Local production of T cells in the FOXN1−/− human intestine.
(A) Quantitative real-time PCR showing the expression of mRNAs encoding RAG1, RAG2 and pTα (relative to β-actin) in skin fibroblasts (negative control), thymus (positive control) and intestinal tissue of control and FOXN1−/− fetuses (16 weeks of gestation). (B) Comparison of TCR Vβ-region usage between intestinal lymphocytes (black bars) and CBMCs (white bars) from the FOXN1−/− fetus. Experiments were repeated three times in (A) and two times in (B).

