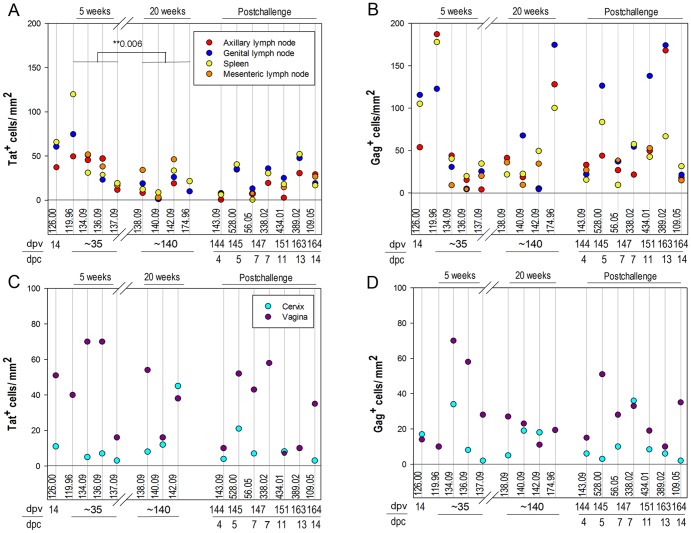
Figure 6. Abundance of SIV-specific CD8 T cells in lymphoid and genital tissues.
The number of MHC-tetramer+ cells per mm2 in lymphoid tissues is presented in panels A) and B) and in the lamina propria of genital tissues in panels C) and D). The tissue density of Mamu-A1/Tat stained cells are shown in A) and C), and Mamu-A1/Gag stained cells shown in B) and D). Animal numbers, days post-SIVΔnef vaccination (dpv) and days post-challenge (dpc) are indicated below each graph. Negative control sections stained with Mamu-A1/FLP showed a range of 0-3.4 cells/mm2 and average of 1.25 cells/mm2 in lymphoid tissues, and 0 cells/mm2 in the genital tissues.

