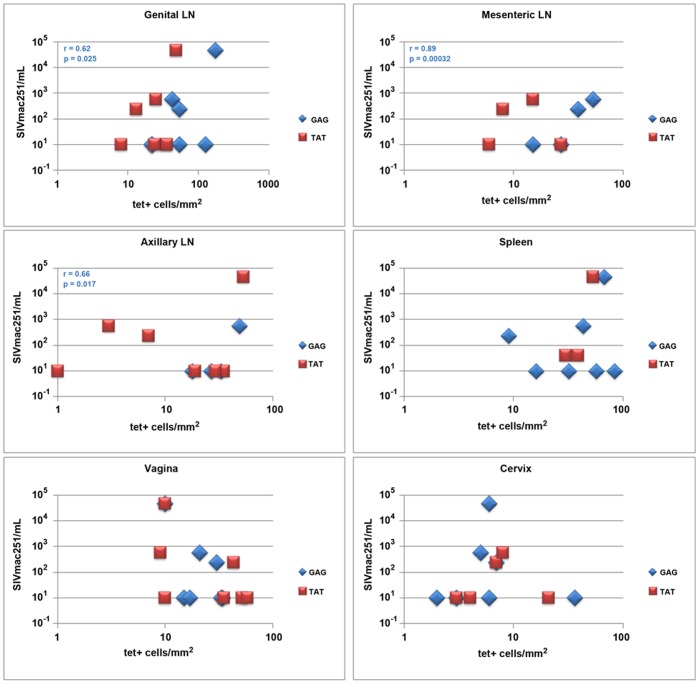
Figure 8. Comparison of plasma WT-SIV virus load and tissue densities of tetramer+ SIV-specific CD8 T cells.
Tissue densities of Mamu-A1/Gag (blue) and MamuA1/Tat (red) tetramer+ cells for each tissue including genital, mesenteric, and axillary lymph nodes, spleen, vagina and cervix compared to levels of WT-SIV in plasma. Plasma viral load value listed as 10 were below the limits of detection of the assay. A significant positive association was observed between the plasma viral load and MamuA1/Gag tetramer+ cells in lymph nodes.

