
Figure 1. TLR and other LPS-response elements in LPS-stimulated HSCs.
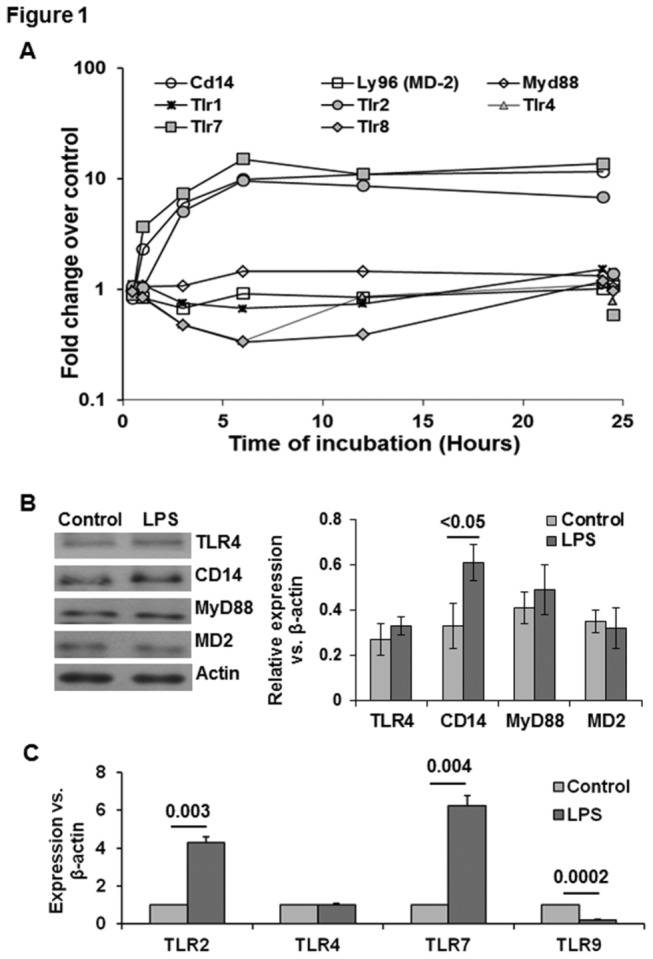
(A) Microarray data show time-dependent changes in the indicated transcripts. For clarity control gene expression at 1 and 24h is offset to 0.5h and 24.5h respectively. (B) A representative Western blot (left pane) and densitometric analysis (right panel) of the indicated molecules at 24h following stimulation with 10 ng/ml LPS. (C) qPCR analysis of the indicated molecules with p values showing statistical differences. The values (B,C) shown are form 3 separate determinations from different batches of HSCs. Statistical significance was derived from student’s t-test using Microsoft-excel program.