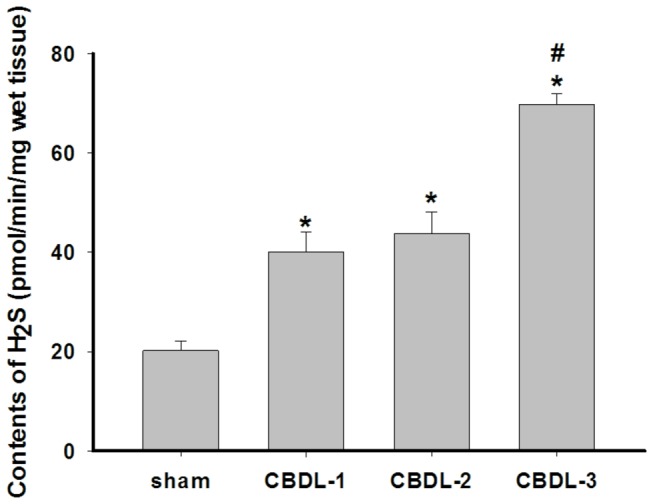
Figure 3. H2S synthesis in the gallbladder from guinea pigs.

Data shown are the mean ± SD (n=12/group). * P <0.01 vs. sham; #P <0.01 vs. CBDL-1 and CBDL-2.

Data shown are the mean ± SD (n=12/group). * P <0.01 vs. sham; #P <0.01 vs. CBDL-1 and CBDL-2.