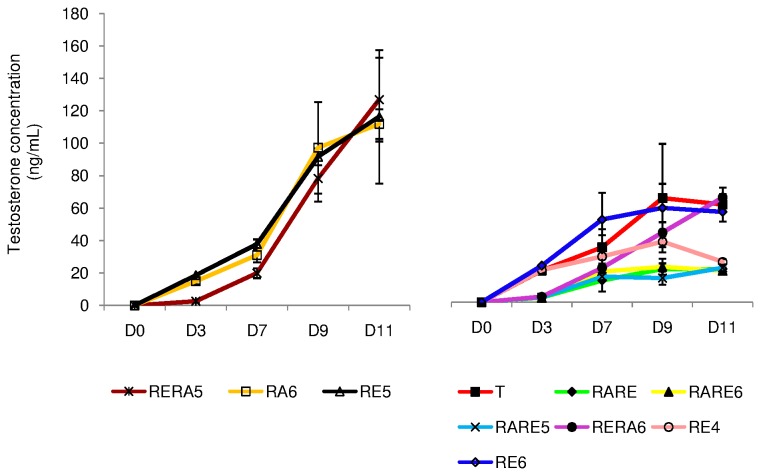
Figure 9. Evolution of testosterone concentrations (ng/mL) in culture media collected between D0 and D11.
The results are represented as the mean ± SEM with n=6.
Footnotes:
T: basal culture medium without retinoid; RARE: 3.3.10-7M RA and 3.3.10-7M RE; RARE6: 3.3.10-7M RA and 10-6M RE; RARE5: 3.3.10-7M RA and 10-5M RE; RERA6: 3.3.10-7M RE and 10-6M RA; RERA5: 3.3.10-7M RE and 10-5M RA; RA6: 10-6M RA; RE6: 10-6M RE; RE5: 10-5M RE; RE4: 10-4M RE; In vivo: In vivo control.
RA: Retinoic acid; RE: Retinol; D0: Day 0; D7: Day 7; D9: Day 9; D11: Day 11

