
Figure 2. The differentially expressed genes of Jatropha curcas after cold exposure for schemed time points.
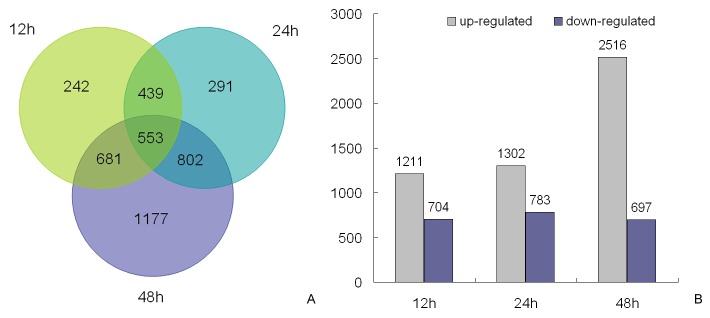
A: Venn diagram indicating the total number of differentially expressed genes after 12, 24, and 48 h of 12°C (≥2-fold change in expression). B: Classified number of upregulated and downregulated genes for each time point of the three cold treatments.