
Figure 10. Number and expression model of novel Jatropha curcas genes after cold exposure for schemed periods.
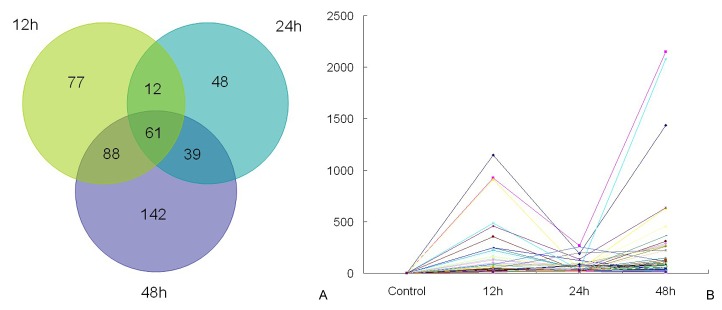
A: Venn diagram indicating the total number of novel, expressed genes after 12, 24, and 48 h of 12°C. B: Expression model of common, novel genes at three time points. The vertical line indicates the raw expression of novel genes in each sample.