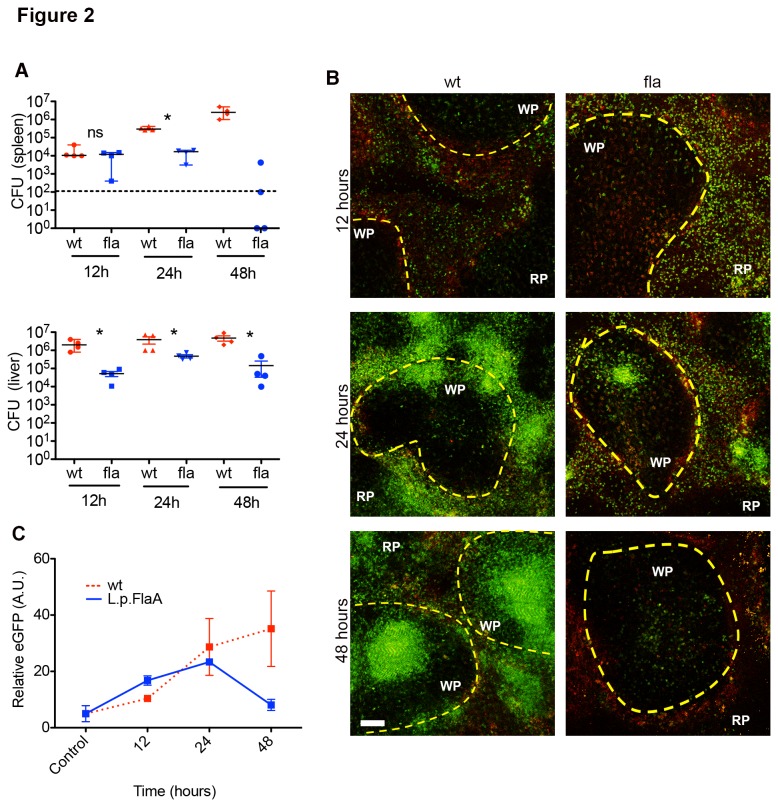
Figure 2. Reduced MMC accumulation after Inflammasome activation.
(A) 8-10 week old C57BL/6 mice were infected intravenously with 2.5x10⁴ wt or 1x10⁵ L. monocytogenes L.p.FlaA for 12, 24, and 48 hours. Bacterial CFU from spleen and liver were collected at the indicated time points. Dotted line – limit of detection. The median of four replicates from 4 independent experiments. *P < 0.05 by Mann-Whitney test. (B) LysM+/eGFP mice were infected intravenously with 2.5x10⁴ wt or 1x10⁵ L. monocytogenes L.p.FlaA for 12, 24, and 48 hours. At the indicated time spleens were excised, sectioned, and image using multi-photon microscopy. Multi-photon images of LysM+/eGFP mice at 12, 24, and 48 hours after infection. LysM+/eGFP- green, yellow dotted line-marginal zone, WP-white pulp, RP-red pulp (C) Relative GFP intensity inside individual WP nodule (A.U.). Data representative of 3 independent experiments.

