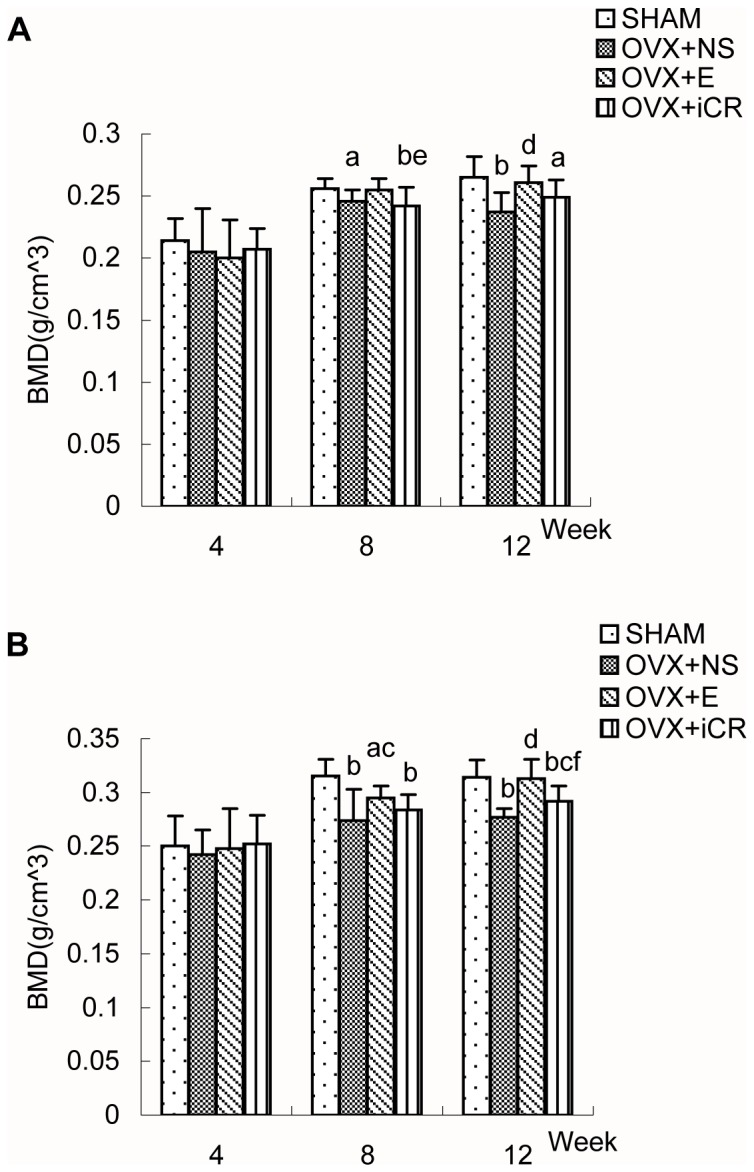
Figure 2. The BMD of femoral proximal and distal ends of the four groups.

Comparison of bone mineral density (BMD) of femoral proximal ends (A) and distal ends (B) in SHAM, OVX+NS, OVX+E and OVX+iCR groups at 4-, 8- and 12-week postoperation. Data represents the means ± standard deviation (SD ), n = 10 rats in each group. The x-axis represents time after surgery (weeks). Compared with SHAM group, a means p<0.05, b means p<0.01; Compared with OVX+NS group, c means p<0.05, d means p<0.01; Comparison between OVX+iCR and OVX+E group, e means p<0.05, f means p<0.01.
