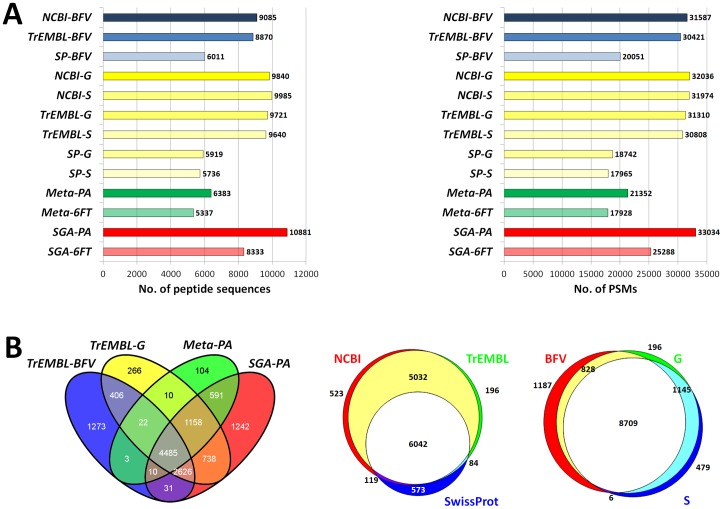
Figure 2. Comparison of metaproteomic data obtained with different databases.
A) Number of peptide sequences (left) and peptide-spectrum matches (PSMs, right) identified in the 9MM using different sequence databases (FDR<1%). B) Left, Venn diagram illustrating the peptide distribution among four different DB classes. Center, Venn diagram illustrating the peptide distribution among all NCBI-, TrEMBL- and SwissProt-based DBs used in this study. Right, Venn diagram illustrating the peptide distribution among all DBs with generic microbial taxonomy (BFV), genus-specific taxonomy (G), and species-specific taxonomy (S).

