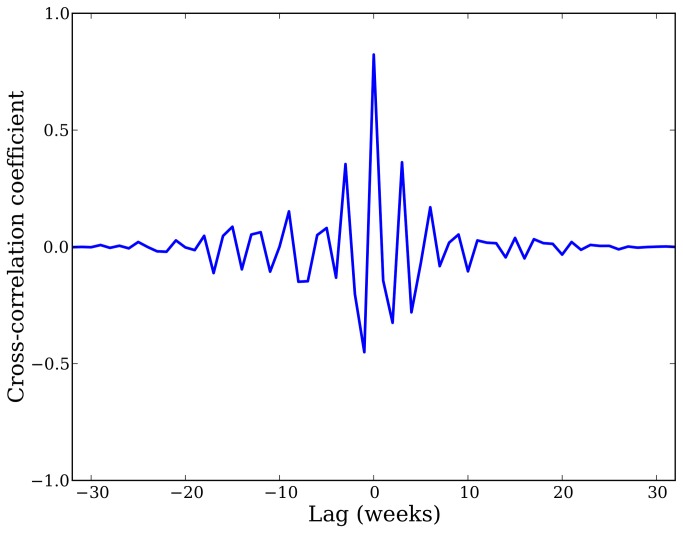
Figure 3. Cross-correlation between Twitter infection rates and CDC ILI rates.
This figure shows the cross-correlation function for the residuals of the second-order-differenced CDC and Twitter infection data, as described in the “Time Series Analysis” section. These results show that the Twitter estimates neither lead nor lag the CDC ILI rates, although the Twitter data are publicly available up to two weeks earlier than CDC data.

