
Figure 2. Multivariable adjusted associations of natriuretic peptides with the lowest sex-specific quartile of visceral fat mass (<1.3 kg for women and <1.8 kg for men) by age, sex, race, and obesity subgroups.
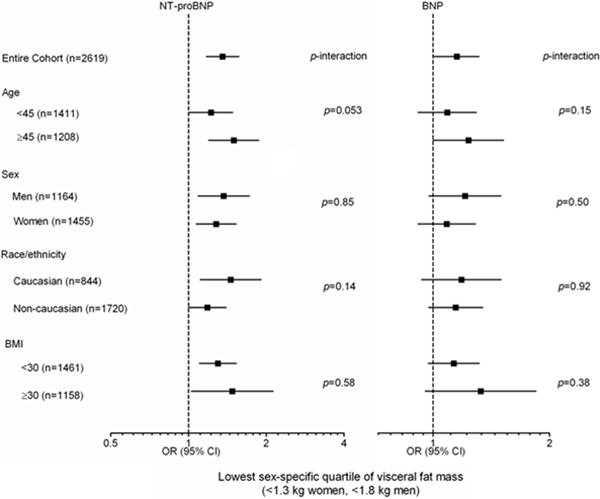
Odds ratios (95% confidence intervals) per 1-standard deviation increment in the log-transformed natriuretic peptide level. Adjusted for age, sex, African-American race, hypertension, diabetes, left ventricular mass/BSA, estimated GFR, smoking, and total body fat and lean mass. p-value for subgroup interaction.