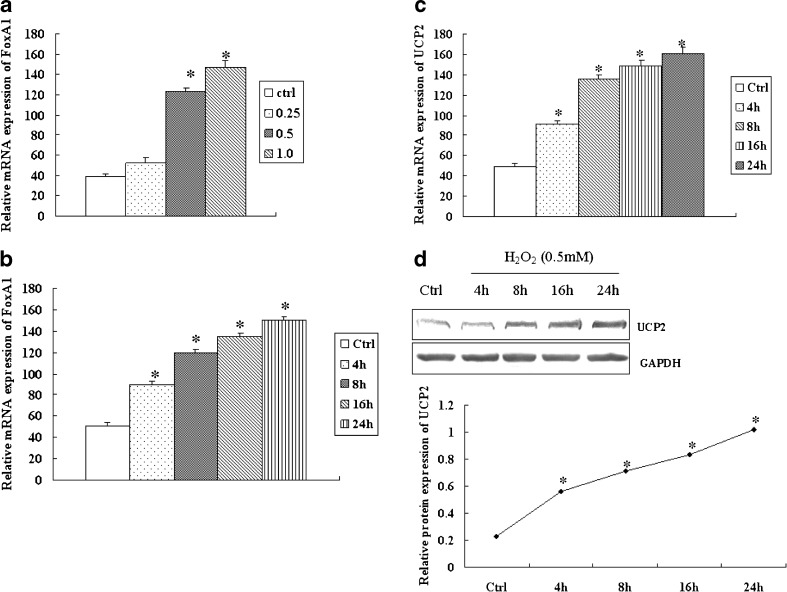
Fig. 1.
Expression of FoxA1 and UCP2 in H2O2-stimulated A549 cells. a A549 cells were stimulated with H2O2 at the indicated dose for 4 h, and mRNA levels of FoxA1 were determined by RT-PCR. b A549 cells were stimulated with H2O2 (0.5 mM) for various periods of time and mRNA levels of FoxA1 were determined by RT-PCR. A549 cells were stimulated with H2O2 (0.5 mM) for various periods of time, and mRNA or proteins of UCP2 were determined by RT-PCR (c) and Western blot (d). The relative values of all results were determined and expressed as mean ± SEM of three experiments in duplicate. *P < 0.05, statistically significant difference versus control group (Ctrl)

