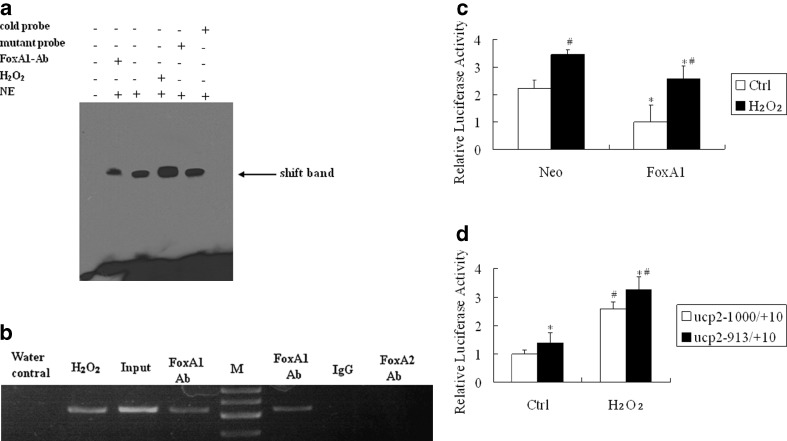
Fig. 3.
DNA binding activity and transcription activity of FoxA1 to the FoxA1 binding element of UCP2 promoter in A549 cells. a FoxA1 bound to the FoxA1 binding element in the region −919 to −913 bp in the UCP2 promoter, as shown by EMSA. Cold probe Competition with cold probe (200-fold excess concentration); mutant probe competition with mutant cold probe (200-fold excess concentration); FoxA1 Ab supershift group by Foxa1 antibody; H 2 O 2 cells were stimulated by H2O2 (0.5 mM) for 30 min; NE nuclear extract. b Association of FoxA1 with UCP2 promoter shown by ChIP. Chromatin was extracted, and binding of FoxA1 to the UCP2 promoter was analyzed by ChIP using a pair of primers that contained the FoxA1 binding site at −919 to −913 bp, which specifically targeted the human UCP2 proximal promoter region. The cross-linked protein–DNA complexes were immunoprecipitated with the anti-FoxA1 antibody (lanes 2, 4, and 6), or with a purified rabbit IgG as a negative control (lane 7), or with the anti-FoxA2 antibody as a specific control (lane 8). PCR of the input (sample representing PCR amplification from a 1:25 dilution of total input chromatin from the ChIP experiment) is shown in lane 3. The PCR control represents the PCR amplification in the absence of DNA (lane 1). Lane M marker; lane Water control negative control; lane H 2 O 2 H2O2 treatment (0.5 mM for 30 min) plus FoxA1 antibody; lane Input positive control; lane FoxA1 Ab untreated cells plus FoxA1 antibody; lane IgG control negative control for FoxA1 antibody; lane FoxA2 Ab untreated cells plus FoxA2 antibody. The image is representative of three independent experiments. c A549 cells were transiently co-transfected with an expression plasmid of FoxA1 (500 ng) and a reporter driven by UCP2 promoter (500 ng). All transfections were performed at least three times in triplicate. *P < 0.05, statistically significant difference versus the vector control group (Neo). # P < 0.05, statistically significant difference from the control group (Ctrl). d Transient co-transfection studies were performed in A549 cells using full-length FoxA1 and a reporter driven by each of the truncate UCP2 promoter (500 ng). *P < 0.05, statistically significant difference from the UCP2 –1,000/+10 group. #P < 0.05, statistically significant difference from the control group (Ctrl). Ctrl cells were untreated with H2O; H 2 O 2 cells were treated with H2O2 for 30 min; Neo vector control group; FoxA1 full-length FoxA1 group

