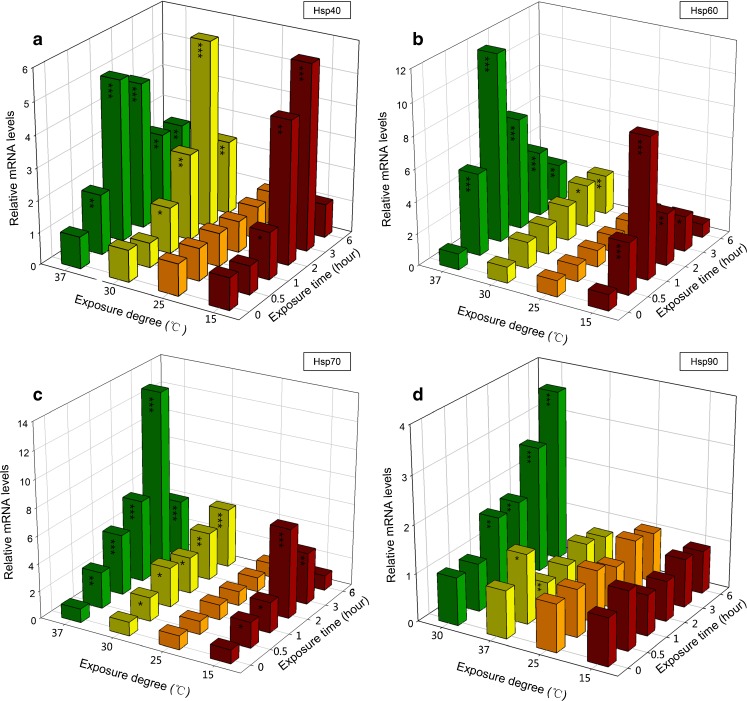
Fig. 3.
Hsps mRNA expression of B. calyciflorus at different temperature exposures of 10, 30, and 37 °C with control (25 °C). The expression levels of hsps mRNA was statistically analyzed by one-way ANOVA with the Tukey test (*p < 0.05; **p < 0.01; ***p < 0.001): a hsp40, b hsp60, c hsp70, and d hsp90

