
Figure 1.
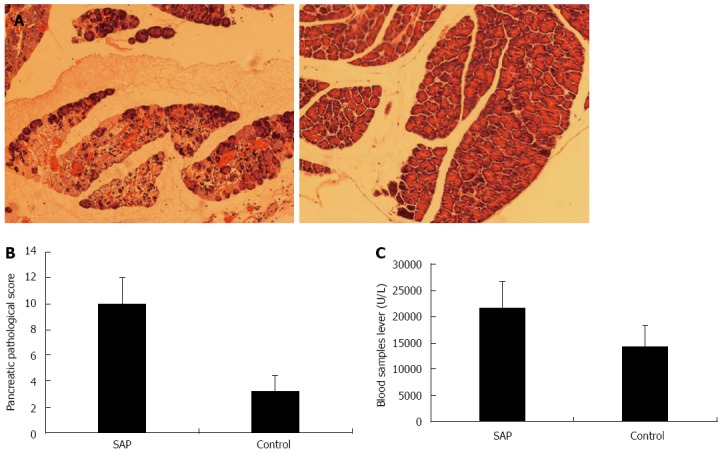
Pancreas histology and serum amylase level in severe acute pancreatitis and control mice. A: Representative photomicrographs of the pancreas in severe acute pancreatitis (SAP) (left panel) and control (right panel) mice (hematoxylin-eosin, × 100); B: Schmidt’s acute pancreatic damage scores in SAP and control mice, P < 0.01 vs control; C: Serum amylase levels in SAP and control mice, P < 0.01 vs control.