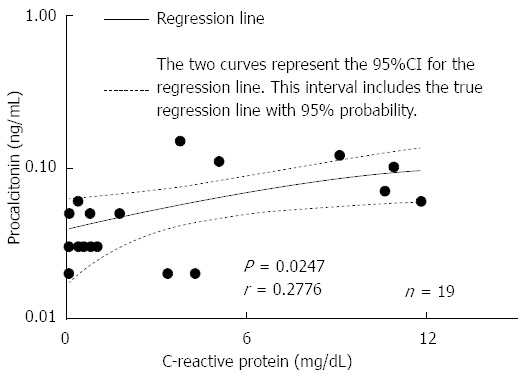
Figure 2.

Correlation of serum procalcitonin levels with C-reactive protein levels in patients with ulcerative colitis. The two curves represent the 95%CI for the regression line. This interval includes the true regression line, with a 95% probability. There was a significant correlation between procalcitonin (ng/mL) and C-reactive protein (mg/dL) levels (r = 0.2776, P = 0.0247).
