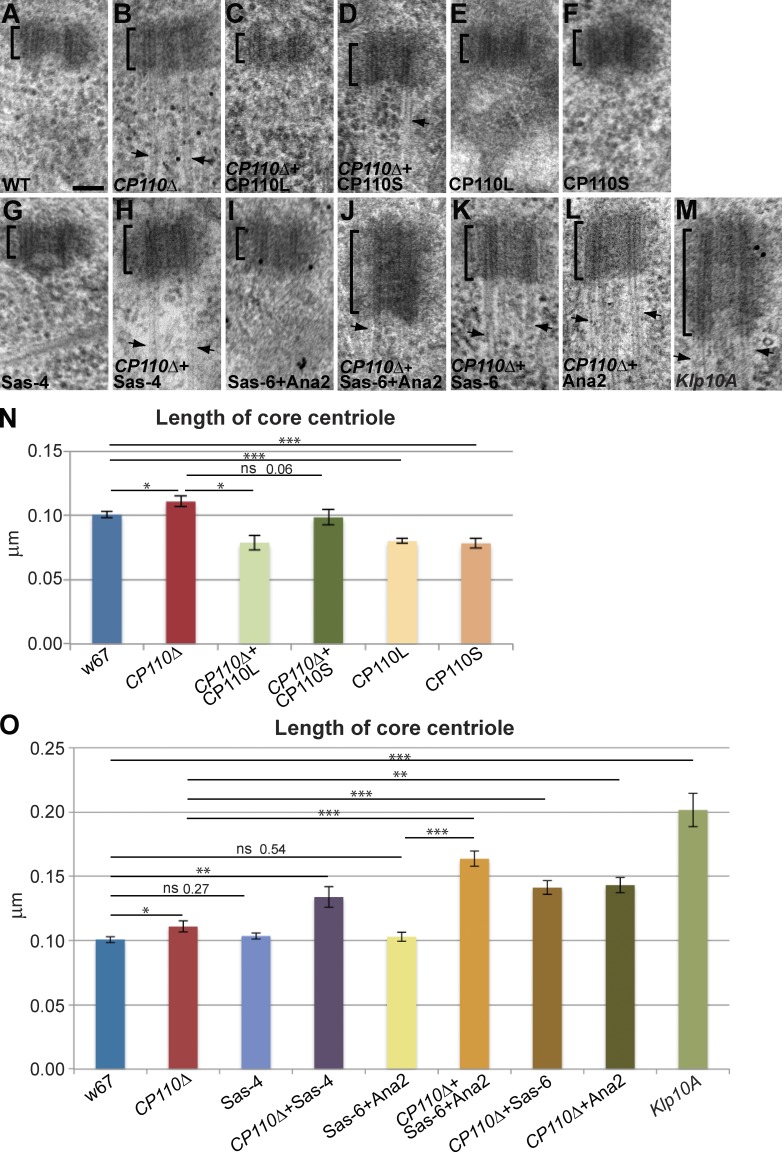
Figure 4.
Cellular CP110 levels influence centriole length. (A–M) Panels show representative EM images of centrioles in larval wing disc cells of various genotypes (as indicated on each panel); n (total centrioles; total wing discs): 134;9 (A), 127;9 (B), 45;4 (C), 53;3 (D), 61;5 (E), 75;5 (F), 109;9 (G), 48;3 (H), 98;8 (I), 87;7 (J), 75;5 (K), 42;4 (L), and 93;7 (M). Arrows highlight MT extensions. (N and O) Bar charts show the quantification of centriole length in these genotypes. Note that the overexpression of CP110S-GFP dramatically shortens centrioles in a WT background, but has a less marked effect in the CP110Δ background (only bordering on the statistically significant). We suspect that this might be because MT extensions are still present in CP110Δ cells overexpressing CP110S-GFP, potentially contributing to the slight lengthening of the centriole. Bar, 100 nm.

