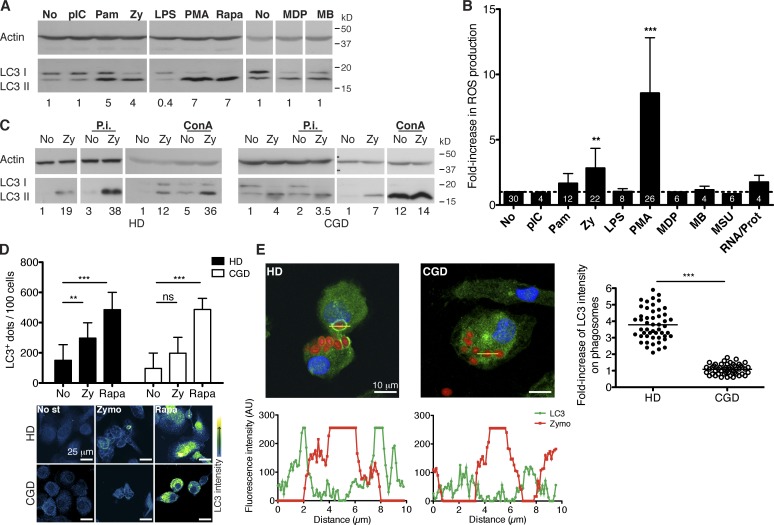
Figure 1.
Atg8/LC3 binding to the phagosomal membrane depends on PRR signaling and on NOX2 activity. (A) Human macrophages were treated with the indicated stimuli for 8 h, and LC3-II levels were assessed by WB. Numbers below the blot represent the fold increase of LC3-II compared with the nonstimulated control cells after normalization to the corresponding actin levels. (B) ROS production was determined after 3 h of PRR stimulation (for PMA stimulation after 30 min), by the increase in fluorescence of the probe Amplex UltraRed. Data are expressed as the means ± SD; paired t test; **, P < 0.01; ***, P < 0.001. Numbers inside the bars correspond to the n values. No increase is indicated as a dashed line. (C) LC3-II protein levels increase both in the presence and in the absence of lysosomal inhibitors (P.i., protease inhibitors; ConA, concanamycin A) for the indicated donors. (D) Quantification of Atg8/LC3+ dots on cells of nine HD and nine CGD patients, treated with the indicated stimuli for 6 h. (bottom) Representative confocal images showing Atg8/LC3 signal intensity. Data are expressed as the means ± SD; **, P < 0.01; ***, P < 0.001. No st, no stimulus; Zymo, zymosan. (E) Macrophages were treated with red-labeled zymosan and stained with Atg8/LC3 antibody and DNA content (DAPI). Profile plots of the fluorescence intensity across the indicated trajectories are shown below the pictures. The graph on the right represents the fold increase of Atg8/LC3 intensity on phagosomes (n = 50) compared with the cytosol signal in HD and CGD cells; mean values are represented as horizontal lines. Mann–Whitney test; ***, P < 0.001. AU, arbitrary unit; pIC, polyinosinic/polycytidylic acid; Pam, Pam3CSK4; Zy, zymosan; LPS, lipopolysaccharide; Rapa, rapamycin; MDP, muramyl dipeptide; MB, murabutide; MSU, monosodium urate crystals; RNA/Prot, RNA/protamine.

