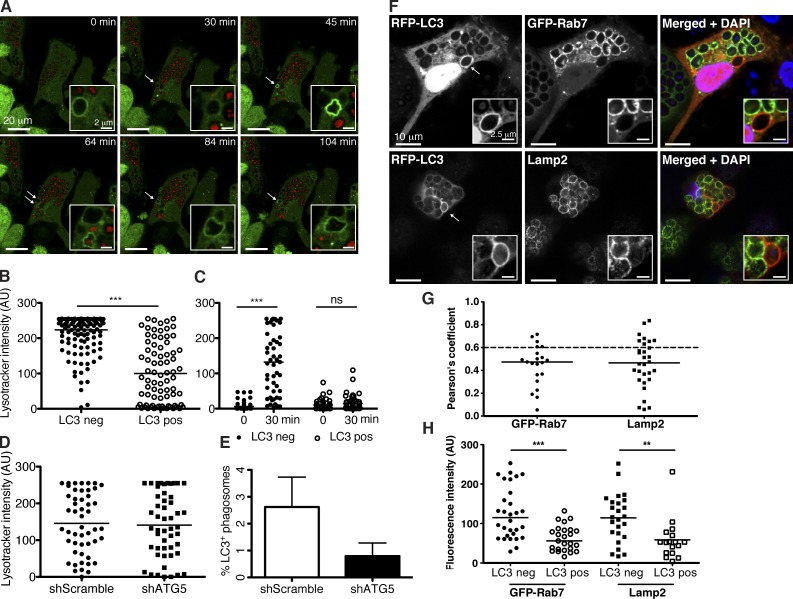
Figure 3.
Phagosomes harboring Atg8/LC3 have delayed maturation. (A) GFP-Atg8/LC3–transduced macrophages were preloaded with red LysoTracker dye for 1 h and incubated with zymosan. Atg8/LC3 recruitment to the phagosomes (white arrows) was followed at 5-min intervals (see Video 3) and LysoTracker signal intensity registered. Insets show a zoomed-in view of the phagosomes of interest. Representative time-lapse images are shown. (B) Lysosomal dye intensity was compared in phagosomes with (LC3 positive [pos]) and without (LC3 negative [neg]) GFP-Atg8/LC3 signal (n ≥ 80); Mann–Whitney test; ***, P < 0.001. (C) Recruitment of the lysosomal dye was followed over time, and signal intensity was registered immediately (0 min) or after 30 min of zymosan uptake within the same phagosome (n = 50); paired t test; ***, P < 0.001. (D) LysoTracker signal intensity was compared in macrophage phagosomes transduced with scramble shRNA versus atg5 shRNA lentiviruses. Graph shows phagosomes (n = 50) analyzed after 2 h of zymosan uptake. (E) Atg8/LC3 recruitment to phagosomes was compared in macrophages transduced with scramble shRNA versus atg5 shRNA lentivirus. Percentage of Atg8/LC3-positive phagosomes is calculated from a total of 50 phagosomes counted in each condition after 5 h of zymosan engulfment. Data are pooled from three different donors. Error bars show SDs. (F) Macrophages transduced with RFP-Atg8/LC3 lentiviral construct were stained for Lamp2 and DAPI or double transduced with the GFP-Rab7 construct. Arrows point to Atg8/LC3-positive phagosomes. Insets show a zoomed-in view of the phagosomes of interest. (G) Pearson’s coefficient values were calculated for each marker in Atg8/LC3-positive phagosomes (n ≥ 20). A Pearson score >0.6 is indicated in each graph as a dashed line. (H) Indicated marker signal intensity was compared in Atg8/LC3-positive versus negative phagosomes (n ≥ 25). Mean values are represented as horizontal lines. **, P < 0.01; ***, P < 0.001. AU, arbitrary unit.

