Figure 4.
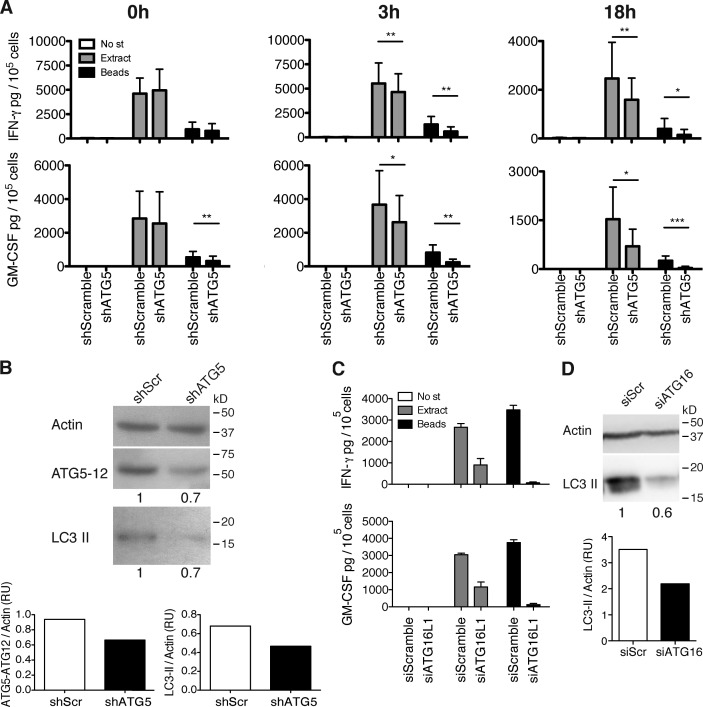
Components of the molecular machinery of macroautophagy can stabilize pathogen-containing phagosomes for prolonged antigen processing onto MHC class II molecules. (A) IFN-γ and GM-CSF ELISAs on supernatants of the C. albicans–specific T cell clone, co-cultured with cognate macrophages transduced with lentiviral atg5-specific or control shRNA, and pulsed or not pulsed with C. albicans extract or C. albicans–coated beads. Time indicated above each graph corresponds to the time point at which the T cells were added for co-culture, after the initial 4 h of pulsing. Bars represent means ± SD of data pooled from three independent experiments; paired t test; *, P < 0.5; **, P < 0.01; ***, P < 0.001. No st, no stimulus. (B) atg5 silencing levels were controlled by WB for LC3-II and Atg5–Atg12 complexes on day 3 after transduction and quantified by densitometry. Numbers below the blot represent the fold increase of LC3-II or Atg5–Atg12 complexes compared with the control cells after normalization to the corresponding actin levels. The results are representative of three assays, corresponding to the experiments shown in A. shScr, scrambled shRNA. (C) Same as in A using macrophages transfected with atg16L1 siRNA or control siRNA. After 4 h of pulsing, cells were washed and incubated in new medium for an additional 18 h before the T cells were added. Error bars show SDs. (D) atg16L1 silencing levels were controlled by WB for LC3-II on day 2 after transduction and quantified by densitometry. Numbers below the blot represent the fold increase of LC3-II compared with the control cells after normalization to the corresponding actin levels. One representative blot out of two performed is shown. RU, relative units; SiScr, scrambled siRNA.

