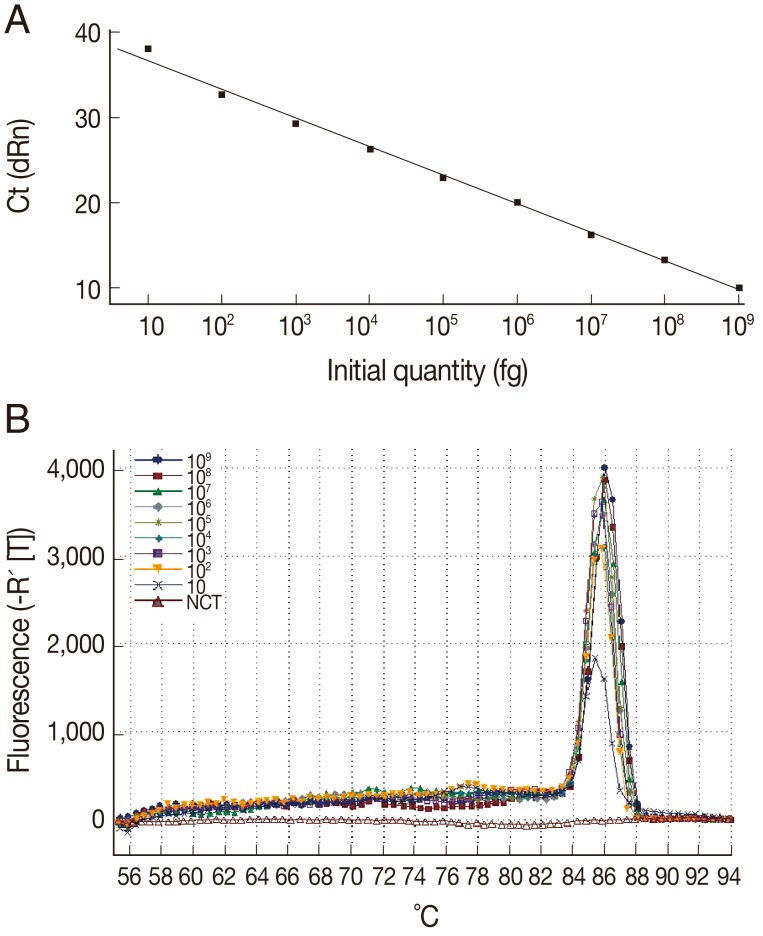
Fig. 2.
Sensitivity and specificity of the Q-PCR assay for T. gondii. (A) Standard curve of Q-PCR for T. gondii. (B) Dissociation curve of Q-PCR for detecting T. gondii. The assay standard curve was generated from a 10-fold serial dilution of a known concentration of T. gondii tachyzoite genomic DNA (equivalent to a range of 0.1-10,000,000 tachyzoites per Q-PCR reaction).

