
Figure 2.
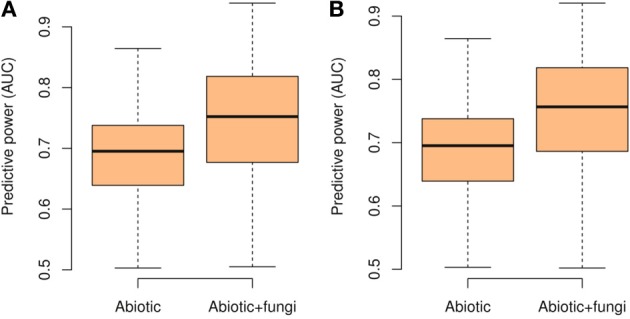
Boxplot of the predictive power of the species distribution models measured with the area under the curve (AUC) when considering only abiotic predictors or additionally including also the number of OTUs of potentially mutualistic fungi. Shown are the results for Glomeromycetes (A)and Agaricomycetes (B).