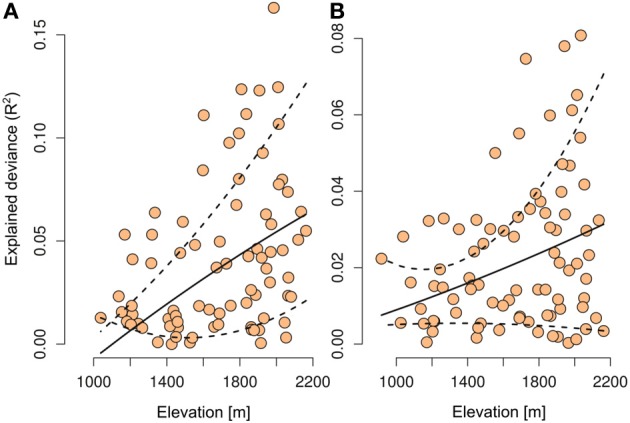
Figure 3.

Relationship between the average elevation where a plant species is found and the explained deviance of the models when only the number of OTUs is included in the species distribution models. Shown are the results with Glomeromycetes (A) and Agaricomycetes (B) when considered alone as predictor in the species distribution models. The dashed lines represent the 10th and 90th percentile confidence interval from quantile regression.
