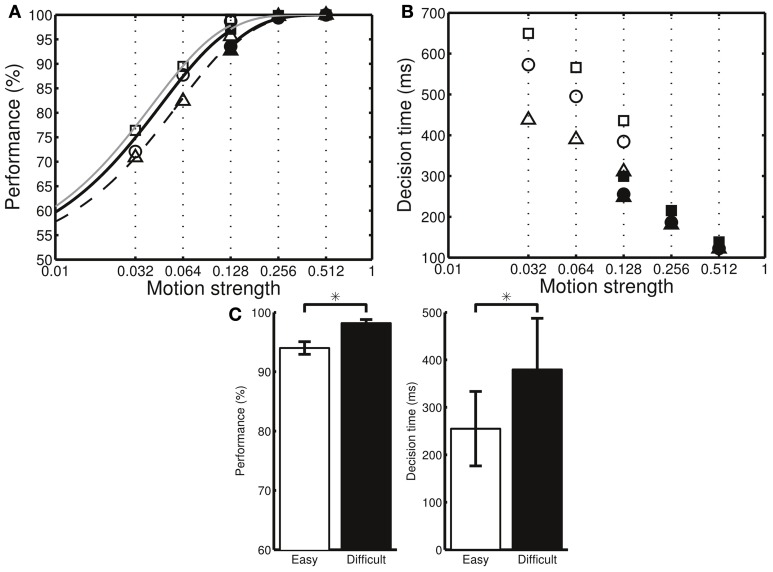
Figure 6.
The three different model settings (a–c in Figure 5) result in different behavioral performances. (A) The percentage correct is higher in the setting that emphasizes accuracy (squares: setting c, circles: setting a, triangles: setting b). Filled and open symbols indicate the data for the difficult and easy conditions, respectively. To help visualize the differences, the data were fitted separately in the two conditions using where β is a fitting parameter. (B) The mean decision times for the same model settings. The mean decision times are smaller in the setting that emphasizes speed. Both easy and difficult conditions include the stimulus motion strength of c′ = 12.8%. However, due to the decision adaptation, the neural circuit converges to different levels of Cx-CD synaptic strengths in the two task conditions. As a result, the behavioral performances for the same motion strength of c′ = 12.8% in the two task conditions are different. (C) By analyzing the data from setting a, we found that the percentage correct (left panel) is higher, while the mean decision time (right panel) is larger in the difficult than in the easy conditions. *p < 0.05.

