
Figure 1.
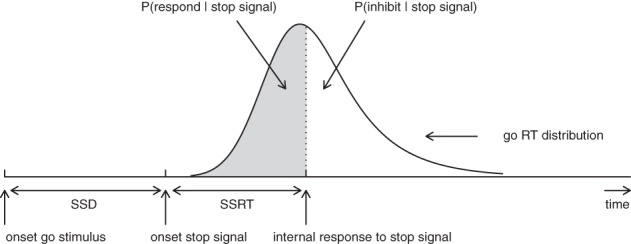
Graphical representation of the independent horse-race model. The success of response inhibition is determined by the relative finishing times of the go and the stop process. Primary task “go” RTs that are longer than SSD + SSRT are successfully inhibited (i.e., white area); go RTs that are shorter than SSD + SSRT escape inhibition and result in signal-respond RTs (i.e., gray area; see also Matzke et al., 2013). Constant SSRT is assumed.