
Figure 8.
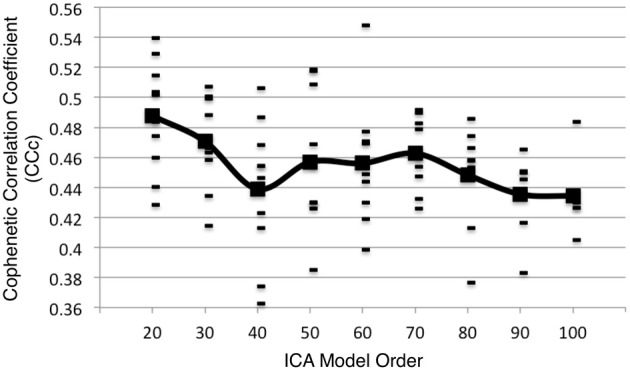
Additional analyses were performed on 10 random subsets of 90% of the experiments in the BrainMap database at the time of the initial analysis following the same procedure as outlined in Figure 1 (up to d = 100). The CCc values resulting from the 90% subsets follow a similar trend as shown in Figure 3 when averaging across all subsets.