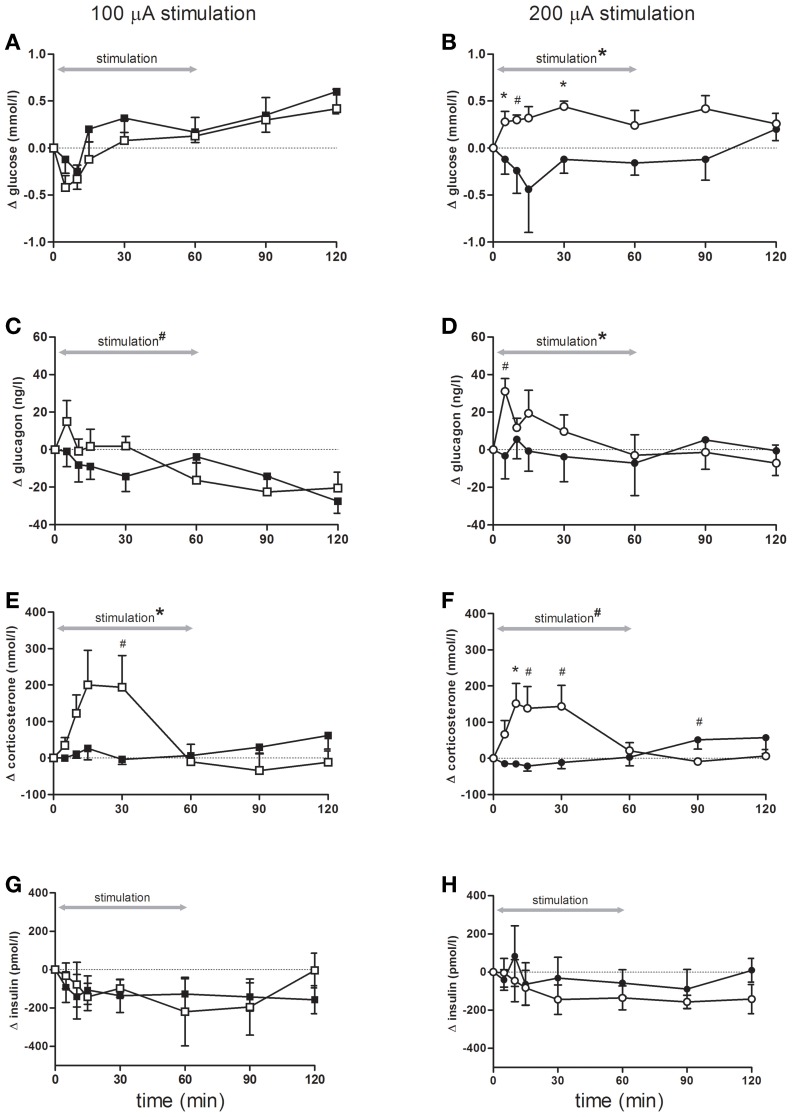
Figure 2.
Blood glucose concentrations (A,B), and plasma- glucagon (C,D), corticosterone (E,F) and insulin (G,H) concentrations during and following stimulation. Effects of 100 μA stimulation (n = 6) are shown in the left column, black squares = sham stimulation, white squares = 100 μA stimulation (A,C,E,G), the right column (B,D,F,H) shows stimulation at 200 μA (n = 5), black circles = sham stimulation, white circles = 200 μA stimulation. All data are presented as mean ± SEM. *p < 0.05, #p < 0.10. (A–B) Blood glucose concentrations were significantly elevated following stimulation at 200 μA compared with sham stimulation. (A) An overall time effect (p < 0.001), but no stimulation or interaction effect. (B) rmANOVA indicated an effect of stimulation (p = 0.03), post-hoc testing showed that glucose concentrations were significant higher at t = 5, and t = 30 (both p = 0.04), a trend was detected for t = 10 (p = 0.06). (C,D) Plasma glucagon concentrations significantly increased following stimulation at 200 μA compared with sham. (C) An effect of time (p < 0.001) and a trend for time * stimulation (p = 0.09). (D) rmANOVA revealed a significant effect of time (p = 0.05) and time * stimulation (p = 0.03). A trend for higher glucagon elevations was detected at t = 5 (p = 0.07). (E,F) Stimulation at both intensities increased plasma corticosterone concentrations. (E) rmANOVA revealed a time (p < 0.001) and an interaction effect between time and stimulation (p < 0.001). Post-hoc analysis revealed a trend for t = 30 (p = 0.09). (F) rmANOVA revealed a trend for time (p = 0.10), a significant effect of time * stimulation (p < 0.001) and a trend for stimulation (p = 0.07). Corticosterone elevation was significant at t = 10 (p = 0.05) and a trend was detected for t = 15, t = 30, t = 90 (p = 0.07, p = 0.06 and p = 0.08 respectively). (G,H) Plasma insulin concentrations were not significant different between the stimulation and sham condition of either 100 or 200 μA stimulated animals.

