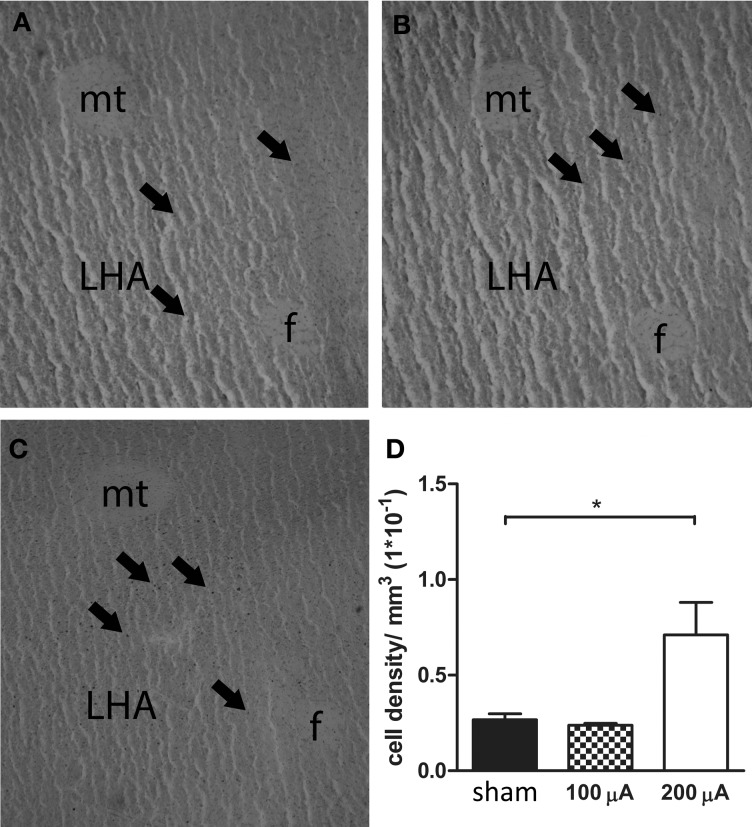
Figure 3.
Representative histological section of a sham (A), 100 μA (B) and 200 μA (C) stimulated rat showing Fos-positive cells in the lateral hypothalamic area (LHA). Arrows indicate Fos-positive nuclei. f, fornix, mt, mammillothalamic tract. (D) Number of Fos positive cells in the LHA of sham, 100 μA and 200 μA stimulated animals (n = 3–5). Fos staining was significantly increased in 200 μA stimulated animals compared to sham stimulated animals (*p = 0.035).

