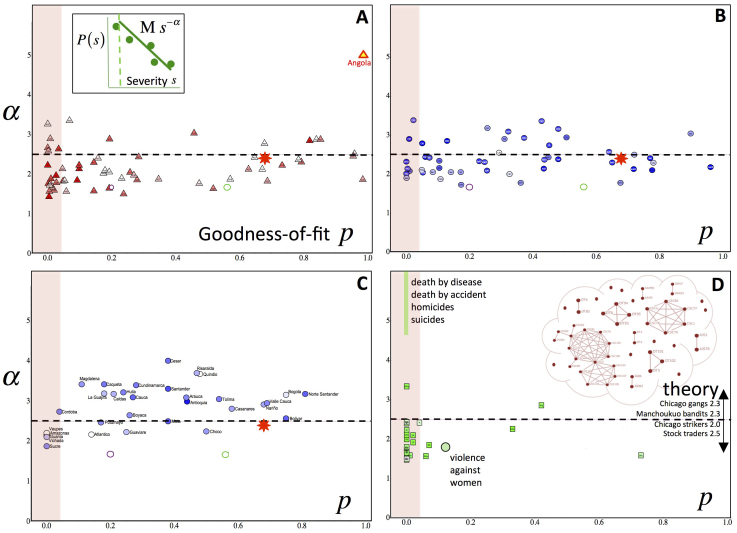
Figure 1. Event-severity benchmark across geographic scales and domains.
Each data-point shows (p, α) values for event severity distribution Ms−α (Fig. 1A inset) for confrontations. (A) within a given continent (Africa); (B) across the globe, for different actors and different injury levels; (C) within a given country (departments in Colombia). (D) shows conventional wars and sexual violence against women5. Suicides etc. form a near continuum at p = 0 with α ≫ 2.5. The darker the color of each data-point, the larger the total number of victims (see SI). Red star shows value for global terrorism17, green ring is value for entire Africa database, purple ring is value for all interstate wars from 1860–1980. Dashed horizontal line shows theoretical benchmark α = 2.5 derived from the simple version of our theory, as described in the text; SI shows α = 2.5 result is robust to generalizations. Red shaded area corresponds to goodness-of-fit p < 0.05. Inset in Fig. 1D shows empirically determined Red operational network for PIRA in South Armagh20. Fig. 1D lists other empirically determined α values. Domains are omitted in Figs. 1,2,3 if we lacked the necessary data (see SI).

