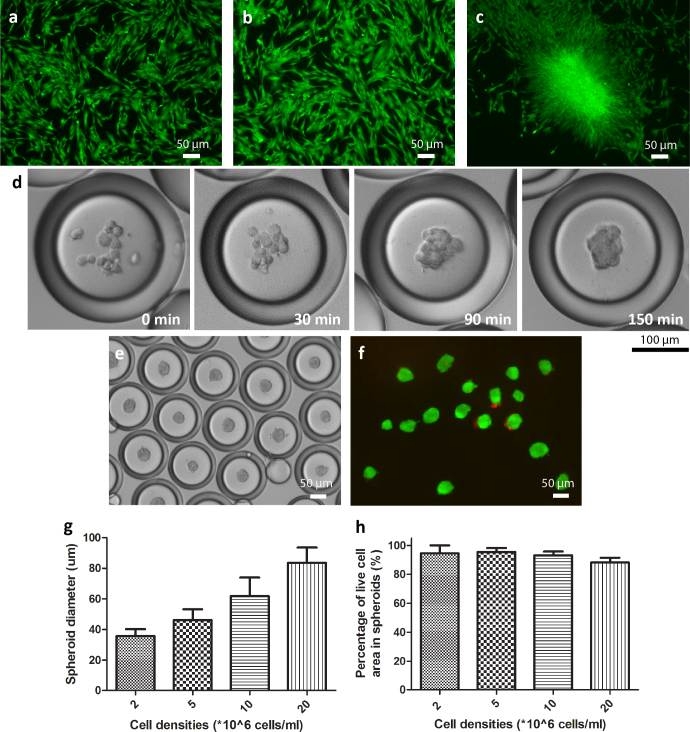
Figure 2. DE droplets generated in device with 200 μm channel width as bioreactor for cell assembly.
Live/dead staining of hMSC after monolayer culture for 1 day with (a) no addition of oil or surfactant, (b) with oil and (c) with 1% Pico-Surf ™ 1 surfactant dissolved in oil. (d) Time course images showing spheroids are formed in 150 min. (e) Phase image of hMSC spheroids encapsulated in DE droplets after 6 hours. (f) Live/dead staining of spheroids after release from DE droplets at 6 hours. Live cells were labeled with calcein AM (green) and dead cells were labeled with propidium iodide (red). (g) Diameter of spheroids measured at different cell densities used (n ≥ 50). (Data = mean ± SD) (h) Percentage of viable cell area in spheroids obtained at different cell encapsulation densities upon release (n ≥ 10). (Data = mean ± SD).

