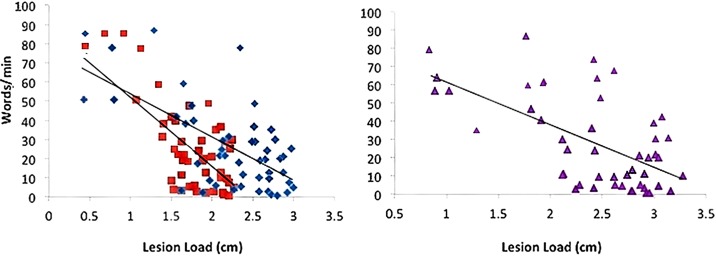
Figure 3.
Words/min vs. AF-, fGM-, and Combined AF-FGM Lesion Loads. Lesion load is displayed on the X-axis, and Words/min is displayed on the Y-axis, and lesion loads are as labeled in Figure 1. All regressions are significant (p < 0.01), and AF-LL predicted words/min significantly better than fGM-LL (p < 0.05).

