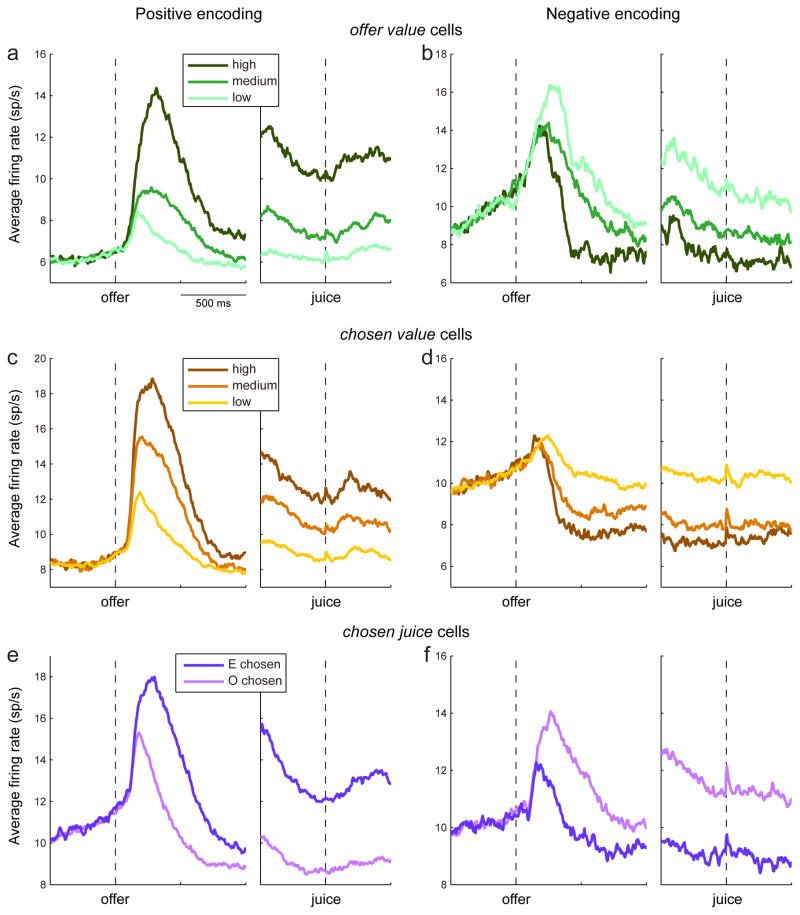
Figure 2.
Average activity profiles. ab. Average population activity for offer value cells. For each cell, trials were divided into three tertiles based on the value of the encoded juice (high, medium and low). The activity of each tertile was averaged across the population. Panels a/b show the activity for neurons with positive/negative encoding (188/57 cells). cd. Average population activity for chosen value cells. Panels c/d show the activity for neurons with positive/negative encoding (161/112 cells). For each cell, trials were divided into three tertiles based on the chosen value (high, medium and low). ef. Average population activity for chosen juice cells. The figure includes only data from Exp.2, for which positive/negative encoding could be established (see main text). Panels e/f show the average activity for neurons with positive/negative encoding (96/50 cells). For each chosen juice cell, trials were divided depending on whether the animal chose the juice encoded by the cell (E chosen) or the other juice (O chosen).

