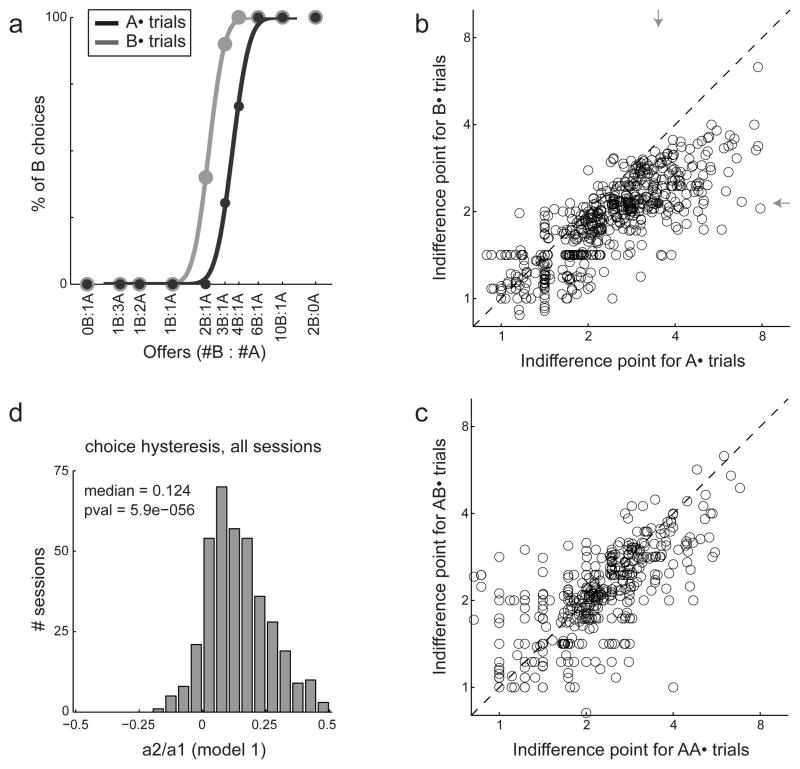
Figure 4.
Choice hysteresis. a. Behavioral data from one example session. Trials were separated into two groups depending on the outcome of the previous trial. The choice pattern obtained when the outcome of the previous trial was juice A (trials A•, dark gray) was displaced to the right (higher indifference point) compared to the choice pattern obtained when the outcome of the previous trial was juice B (trials B•, light gray). b. Choice hysteresis across sessions. Each data point corresponds to one juice pair in one session, and the two axes indicate the indifference point measured in A• trials (x-axis) and B• trials (y-axis). Arrows point to the session shown in (a) (gray circle). c. Choice hysteresis largely dissipated within one trial. The panel compares AA• trials and BA• trials. d. Logistic analysis. The x-axis represents the ratio a2/a1 defined in Eq.1, the y-axis represents the number of session (304 total).

