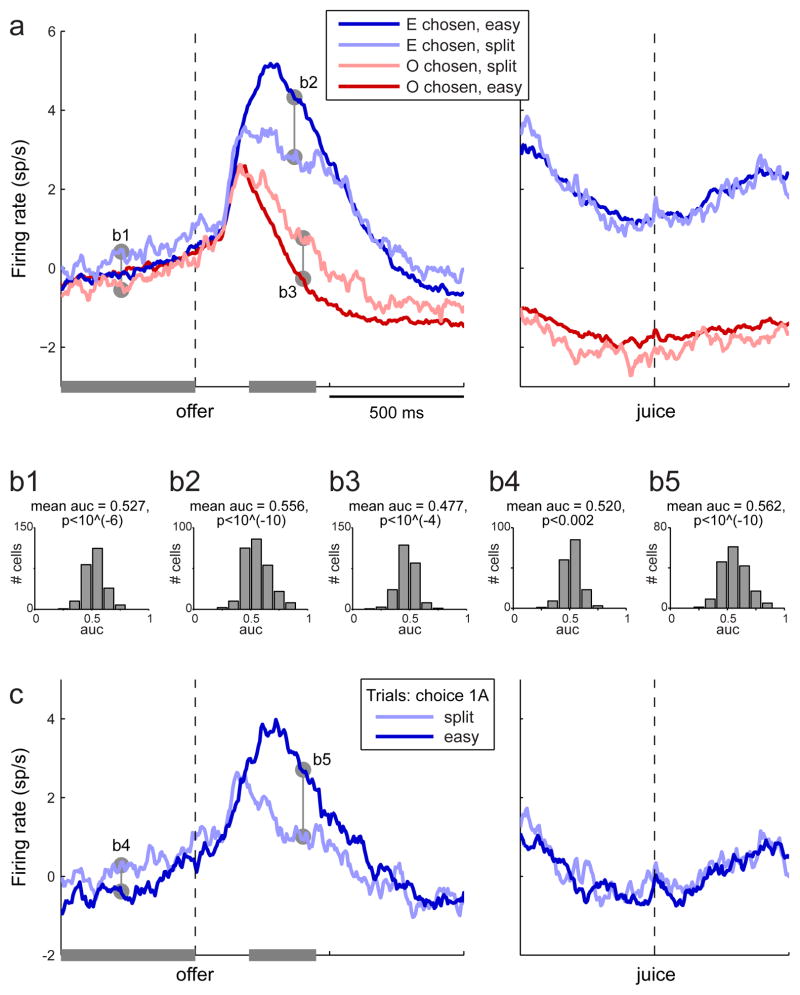
Figure 6.
Activity profiles of chosen juice cells. a. All trials. Neurons from the two experiments were rectified (see main text) and pooled. Trials were divided depending on whether the animal chose the juice encoded by the cell (E) or the other juice (O) and on whether the decisions were easy or split. Average traces shown here are from the 257 cells for which I could compute all four traces (≥2 trials per trace). The activity after the offer depended on the decision difficulty but did not resemble a race-to-threshold. In the 500 ms before the offer, the activity for “E chosen split” trials was elevated compared to that for “O chosen split” trials (predictive activity). b. ROC analyses. Histograms show the results obtained for the five comparisons indicated in panels (a) and (c). c. Control for juice quantity. This analysis focused on trials in which the animal chose one drop of the preferred juice (1A). Trials were divided into easy and split and average traces shown here are from the 181 cells for which I could compute both traces (≥2 trials per trace). All the effects described in (a) were also observed when the quantity of the chosen juice was fixed. (See also Figs. S3–S5.)

