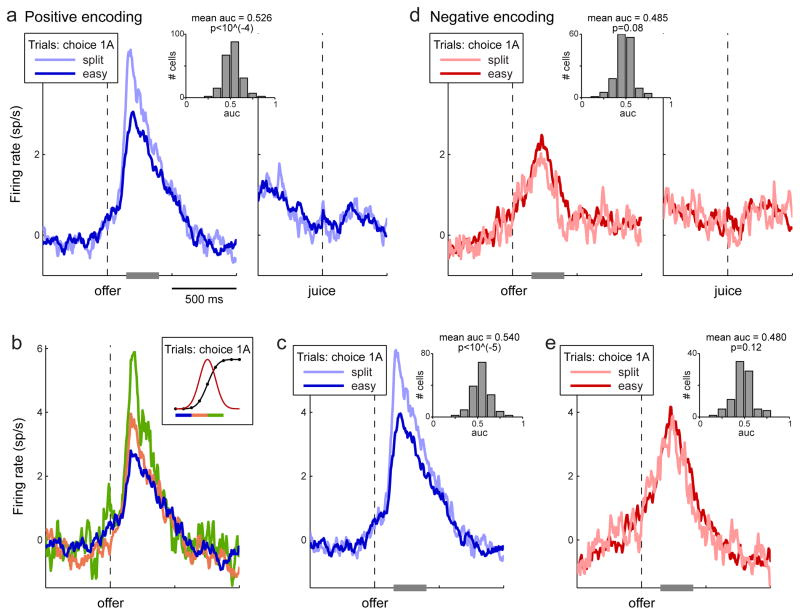
Figure 7.
Activity overshooting in chosen value cells. a. Population with positive encoding. The analysis included only trials in which the animal chose one drop of juice (e.g., juice A). Trials were divided into two groups depending on whether the offer type was easy or split (see legend). Each trace represents the average activity profiles for positive encoding chosen value cells. Averages were calculated including only cells for which I could compute both traces (≥2 trials per trace). Cells from Exp.1 contributed to each average with at most one trace (choices of 1A). However, some cells from Exp.2 contributed with two traces (choices of 1A or 1B). In total, each population trace shown here is the average of 212 individual traces from 151 cells. The insert illustrates the results of the ROC analysis. b. Same analysis as in (b), splitting trials into three groups. In all cases, the animal chose 1A over qB, with variable q. The three groups of trials correspond to easy decisions (dark blue), split decisions with q < mean(ρ) (yellow) and split decisions with q ≥ mean(ρ) (green). Each population trace is the average of 112 individual traces from 90 cells. c. Same analysis as in (a) including only cells that were significantly tuned in the 150–400 ms after the offer. Each population trace is the average of 156 individual traces from 112 cells. d. Population with negative encoding. Each population trace is the average of 155 individual traces from 106 cells. Consistent with the hypothesis that the chosen value fluctuated from trial to trial, the dark red line was slightly above the light red line in the 150–400 ms after the offer. However, the effect was not significant. e. Same analysis as in (e) including only cells that were significantly tuned in the 150–400 ms after the offer. Each population trace is the average of 91 individual traces from 62 cells. (See also Figs. S6–S7.)

