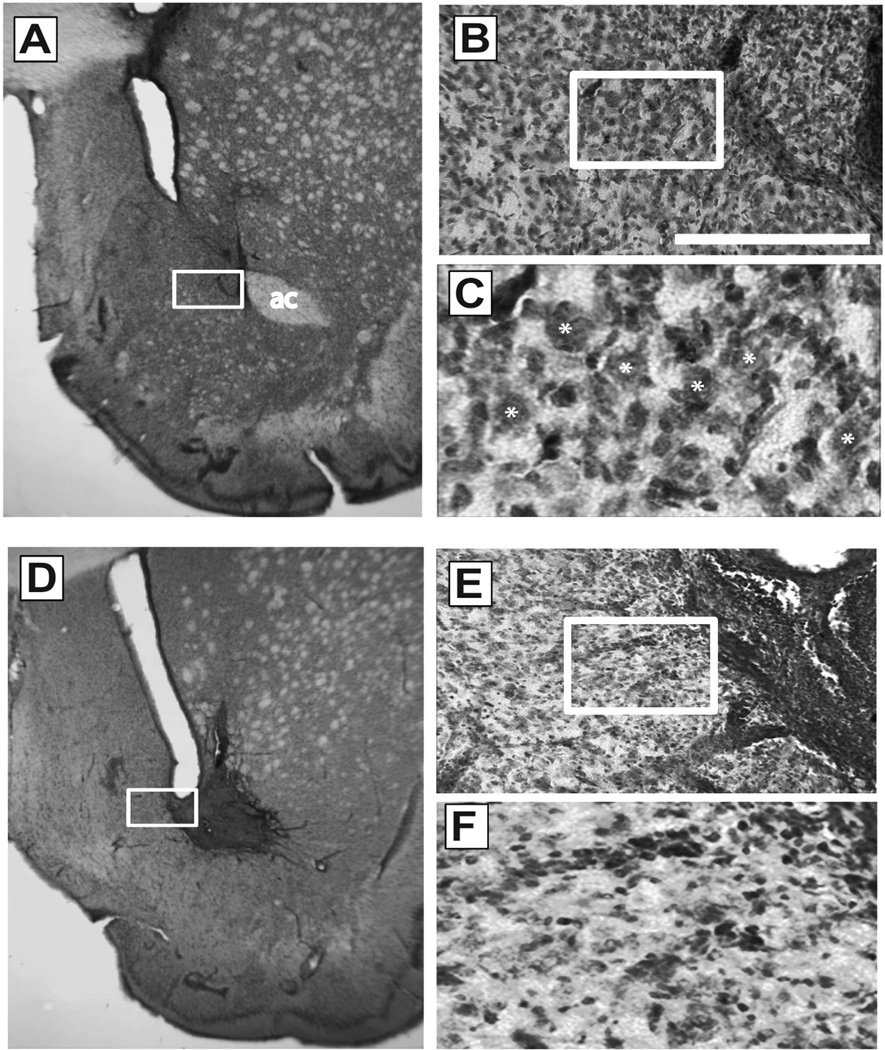
Fig. 2.
Assessment of vivo-morpholinos toxicity by Nissl stain. All images show representative slices from animals microinjected with control vivo-morpholino for GLT-1 at either the low (A–C, 30 pmol) or high (D–F, 1500 pmol) dose. A, representative staining of NAc microinjected with low dose. D, representative staining of NAc microinjected with the high dose. Note the lack of staining of the anterior commissure as seen in panel A (region under “ac”), primary due to the induction of overt neurotoxic damage. B,C and E,F; 20x and 60x magnification of regions boxed in A and D. Comparison at 60x magnification in C and F indicates neurotoxicity as evidenced by smaller, more punctuate staining of cells. Stars in panel C indicate representative healthy medium spiny neurons. Scale bar, 100 µm at 20x magnification; ac, anterior commissure.

