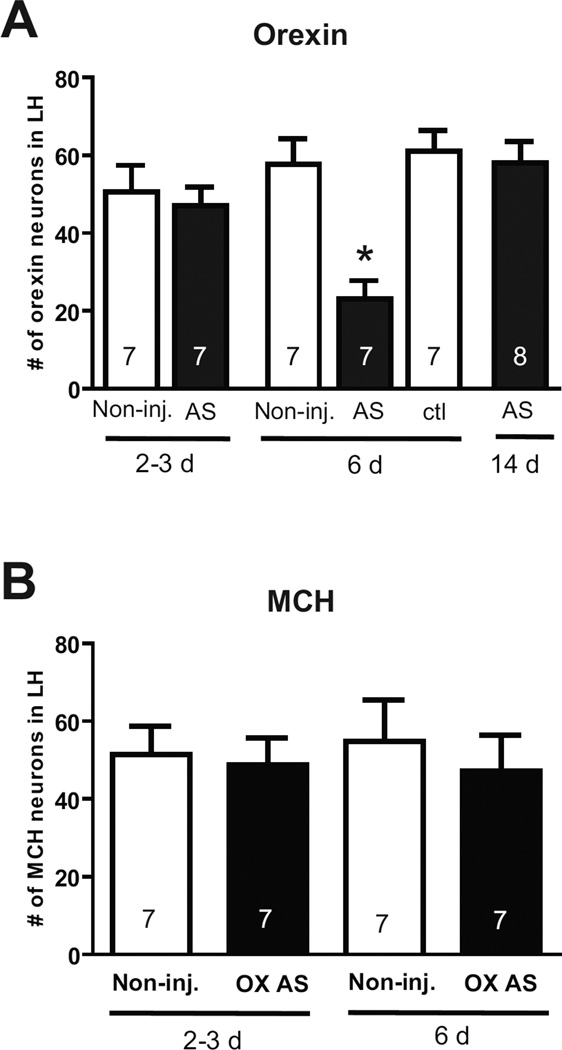
Fig. 4.
Suppression of orexin expression in the LH by vivo-morpholinos. (A) Quantification of cell counts for orexin in the LH at different time points following control (ctl) or antisense (AS) vivo-morpholinos (150 pmol each). Non-inj. indicates cell counts in a non-injected control. One-way ANOVA, (F (5, 37) = 3.76, p<0.01). * indicates p < 0.05 by Tukey post-hoc analysis. (B) Cell counts for MCH following treatment with orexin vivo-morpholinos. In both panels, N represents number of animals.

